

TikTok Shop analytics is not one dashboard. It is a set of first-party shop reports, ad and attribution views, finance records, connected profit tools, external market estimates, and exported files.
That distinction determines whether a number can support a payout reconciliation, a budget change, a creator brief, or only a hypothesis.
The short answer is:
- Use TikTok Shop Seller Center for your actual shop, product, content, and order performance.
- Use Kalodata, FastMoss, Shoplus, or EchoTik to research products, shops, creators, videos, LIVE activity, and competitors outside your own account—but treat their commerce figures as external intelligence, not your ledger.
- Use HiveHQ when the main question is connected TikTok Shop profit and the required cost inputs are complete.
- Use M2E Sales Analytics when you need to compare TikTok Shop with other marketplaces.
- Use Navos when you need AI analysis across authorized TikTok API connections or user-provided CSV/XLSX files. The hands-on test in this guide covers the file-upload path.
There is no defensible “best overall” TikTok Shop analytics tool. The best choice depends on the data you have and the decision you need to make.
The Four Data Layers Behind TikTok Shop Analytics
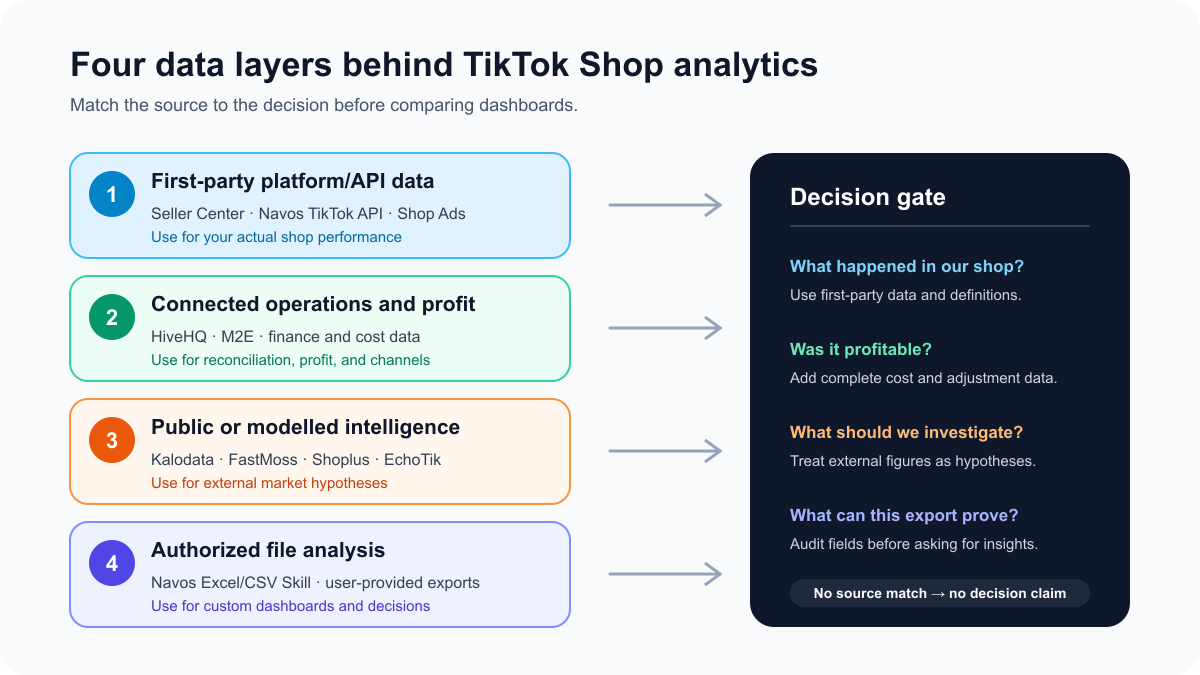
Before comparing features, classify the source. A polished dashboard does not make an estimate first-party data, and a direct connection does not automatically make a profit calculation complete.
Data layer | Typical examples | Best used for | What it cannot prove on its own |
First-party platform/API data | Seller Center, Product Analytics, Shop Ads, GMV Max, and authorized Navos TikTok API workflows | Your actual shop, product, order, content, affiliate, and paid performance | Competitors’ exact sales, your final contribution margin, or a universal market benchmark |
Connected operational or profit data | HiveHQ, M2E Sales Analytics | Reconciliation, profit analysis, customer/product performance, and cross-channel comparison | Broad public-market demand unless the product separately supplies it |
Public or modelled market intelligence | Kalodata, FastMoss, Shoplus, EchoTik | Product, shop, creator, video, LIVE, and competitor research | An audited merchant ledger, exact settlement, or verified competitor profit |
Authorized file analysis | The Navos Excel/CSV Skill analyzing a user-provided file | Data-quality checks, custom dashboards, summaries, comparisons, and action plans | Any metric absent from the uploaded file |
This source-first model prevents the most common analytics error: selecting a tool because it shows many charts, then asking it a question its underlying data cannot answer.
Quick decision rule: use first-party data and authorized API connections to manage what happened in your shop, external intelligence to form market hypotheses, connected finance data to estimate or reconcile profit, and file-analysis tools to turn authorized exports into a reviewable decision artifact.
Four data layers behind TikTok Shop analytics. A source mismatch creates a decision risk.
Where TikTok Shop Performance Data Actually Lives
TikTok Shop metrics are distributed across several current surfaces. Names and locations can change, so the latest US TikTok Shop documentation should be the final authority for your account.
Shop Analytics: the first-party operating baseline
Shop Analytics is the starting point for top-line shop performance. TikTok’s current US guide includes real-time GMV and SKU orders, as well as GMV split by content type.
One definition matters immediately: TikTok states that Shop Analytics GMV includes cancelled and refunded orders. A rising GMV line can therefore coexist with weak commercial quality. Pair it with valid orders, cancellations, refunds, payouts, and cost data before interpreting it as growth or profit. See TikTok’s current Shop Analytics navigation and metric definitions.
Use Shop Analytics to answer:
- Is top-line shop activity rising or falling over a comparable period?
- Which content type contributes to GMV?
- Which products account for the change?
- Does real-time performance require an operational response today?
Do not use GMV alone to answer whether the activity was profitable.
Product Analytics and Product Traffic Analysis: find the funnel constraint
Product Analytics helps explain why a product grew or stalled. TikTok’s current Product Traffic Analysis includes product-level traffic and conversion fields such as impressions, clicks, click-through rate, checkout-to-order rate, average order value at SKU level, GMV, and content-type filters. The current view can also be exported.
These fields let you separate three very different problems:
- Low exposure: the product is not receiving enough qualified impressions.
- Low product interest: impressions arrive, but users do not click through.
- Low purchase conversion: users reach the product flow, but few complete an order.
Each problem requires a different action. More creator posts will not fix an uncompetitive price, and a product-page rewrite will not solve a stock or eligibility issue.
Shop Tab and Search Analytics: understand discovery traffic
TikTok’s Shop Tab & Search Analytics covers metrics including GMV, items sold, impressions, and average daily customers. It also provides traffic-source breakdowns and XLS export.
Use this view when the decision is about discoverability:
- Are search and Shop Tab contributing meaningful traffic?
- Which products receive impressions but fail to generate sales?
- Did a listing, keyword, price, or promotion change affect discovery?
Do not combine search, Shop Tab, video, affiliate, and paid traffic into a single unexplained conversion rate. Their intent and attribution rules differ.
Creator, video, and LIVE analytics: measure distribution and conversion
Creator and content analytics help identify which partnerships and formats create qualified product activity. Useful fields can include video or LIVE views, product clicks, attributed orders, items sold, GMV, and creator contribution, depending on the current module and permission level.
The analytical goal is not to rank creators by views. It is to understand the chain:
creator/content exposure → product interest → checkout/order → cancellation/return → contributionA high-view video with few product clicks may be entertaining but commercially weak. A lower-view video may be valuable if it generates qualified traffic and acceptable post-purchase outcomes.
Shop Ads and GMV Max: check attribution before comparing ROI
TikTok’s current Shop Ads reporting guide includes cost, impressions, clicks, CTR, product-page views, checkout, purchases, purchase rate, items purchased, gross revenue, and ROAS.
However, TikTok documents that Ads Manager gross revenue and Seller Center GMV can differ because the systems do not treat tax and platform-funded discounts identically. Preserve the source and definition for each export instead of copying both values into a column named “revenue.”
GMV Max adds another boundary. TikTok’s GMV Max attribution documentation describes total-channel attribution that can include paid and organic orders for selected products while a campaign is running. Its ROI is therefore not automatically comparable with a paid-only ROAS metric from another campaign type.
For a deeper paid-workflow example, see our hands-on guide to TikTok GMV Max Creative Boost 2.0.
Before changing budget, record:
- campaign type;
- attribution logic and window;
- reporting timezone;
- whether organic orders are included;
- whether the revenue field includes tax or discounts;
- whether the period is complete.
Finance, fees, commissions, refunds, and cost of goods: move from GMV to profit
Neither first-party GMV nor modelled competitor revenue is profit.
A practical contribution calculation may require:
recognized sales − refunds − discounts − platform fees − creator commission − ad spend − shipping/fulfillment − cost of goods − other adjustmentsThe exact formula depends on the business and accounting policy. The principle does not: if the cost and adjustment fields are missing, label the result as revenue or contribution before selected costs—not profit.
The TikTok Shop Metrics That Should Drive Weekly Decisions
Do not begin with a giant KPI dictionary. Begin with the decision that must be made this week.
Decision area | Metrics to inspect | Primary source | Common misreading |
Demand and traffic | Impressions, product-page views, traffic source, Shop Tab/search contribution | Seller Center and Product Analytics | Treating higher impressions as higher purchase intent |
Product interest | Product clicks, CTR, add-to-cart or checkout activity where available | Product Traffic Analysis and content views | Blaming content when price, offer, or listing quality is the constraint |
Conversion | Orders, items sold, purchase rate, checkout-to-order rate, AOV | Seller Center/product data | Comparing different product mixes or incomplete periods |
Creator and content | Views, product clicks, attributed orders/GMV, creator contribution, format mix | Affiliate, video, and LIVE analytics | Ranking creators by views or totals without exposure and attribution context |
Paid performance | Spend, clicks, product-page views, purchases, cost per purchase, gross revenue, ROAS/ROI | Shop Ads or GMV Max | Mixing paid-only and total-channel attribution |
Commercial quality | Cancellations, returns, refunds, commission, fulfillment issues | Seller Center, finance, and operational exports | Treating booked GMV as recognized revenue |
Profit | Net sales, COGS, fees, commissions, shipping, ad spend, contribution margin | Finance plus complete cost inputs | Calling a partial cost calculation “profit” |
Demand and traffic
Traffic metrics answer whether enough eligible shoppers are reaching a product. Compare traffic sources, products, and complete periods. A sharp impression decline may point to inventory, listing eligibility, promotion changes, content volume, or demand; it does not prove which cause is responsible.
Conversion
Conversion metrics locate friction after discovery. Inspect product click-through, checkout or purchase rate, orders, items sold, and AOV together. AOV can rise because shoppers bought more, because the product mix shifted, or because discounts changed. Preserve product/SKU context before celebrating the aggregate.
Content and creator performance
Use exposure, click, order, and post-purchase fields together. At minimum, separate:
- video versus LIVE;
- organic brand content versus affiliate content;
- new creator tests versus mature creator partnerships;
- cumulative totals versus activity within a defined reporting period.
Creator-level totals are often highly concentrated. Use the median, percentiles, and top-one/top-five share alongside total output so that one viral video does not define the entire program.
Paid performance
Spend and ROAS are incomplete without attribution and margin. When comparing campaigns, keep campaign type, product set, period, currency, timezone, and attribution settings consistent. If those settings differ, describe the comparison as directional rather than precise.
Commercial quality and profit
Track what happens after the order. A product that generates high GMV but also high cancellations, refunds, commission, support cost, and fulfillment failures may be a weaker business than a smaller product with reliable contribution.
There is no universal “healthy” TikTok Shop CTR, conversion rate, or ROAS. Benchmarks should come from comparable products, offers, traffic sources, markets, and attribution settings—preferably your own history.
TikTok Shop Analytics Tools Compared
The following tools solve different jobs. Feature and price information was captured from official vendor pages on August 5, 2026; plans and access rules can change.
Tool | Data layer | Best for | Verified access or pricing snapshot | Important boundary |
TikTok Shop Seller Center | First-party | Actual shop, product, order, content, affiliate, and ad performance | Included with an eligible TikTok Shop account | Data is spread across modules and does not provide complete external competitor intelligence |
Kalodata | Public/modelled market intelligence | Broad shop, product, creator, video/LIVE, and competitor research | Vendor advertises a seven-day trial; check the live paid-plan page | Vendor says transaction and ad-spend values may differ from actual figures |
FastMoss | Third-party commerce intelligence/API | Deep product, creator, shop, video/LIVE, category, and API workflows | Paid platform; API pricing advertised from $0.01 per call; confirm live SaaS price | External signals are not the merchant ledger |
Shoplus | Public/modelled market intelligence | Product discovery and creator/competitor tracking | Basic $39/mo; Premium $49/mo; Professional $79/mo displayed | Confirm billing term, market coverage, freshness, and plan limits |
EchoTik | Third-party intelligence/API | Accessible product, shop, creator, video/LIVE monitoring and API use | Free; paid tiers displayed from $9.90/mo with annual billing | Treat sales as estimates and verify plan limits |
HiveHQ | Connected profit analytics | TikTok Shop profit, product, and customer analysis | Free to 250 orders; paid tiers displayed from $39/mo | Profit depends on complete costs, fees, refunds, and reconciliation rules |
M2E Sales Analytics | Connected multichannel data | TikTok Shop comparison with Amazon, eBay, Walmart, and other channels | M2E says Sales Analytics is free for Multichannel Connect users | Not intended for public competitor or creator discovery |
Navos | Official TikTok API connections + authorized file analysis | Connected TikTok Shop/Ads workflows and custom CSV/XLSX analysis | Free $0 plan; paid monthly plans displayed from $19 | This test used the upload path; results were limited by the 13 supplied fields, not by the wider platform's API capability |
TikTok Shop Seller Center — best first-party baseline
Best for: managing your own TikTok Shop performance.
Data source: TikTok’s first-party merchant, content, affiliate, ad, and finance surfaces.
Answers well: what happened in your shop, subject to each metric’s definition and attribution.
Does not answer: competitors’ exact sales or your final profit without full cost data.
Seller Center should be the baseline even if the team buys another analytics product. Start there for actual shop performance, then add external or connected tools for questions the first-party views do not solve.
Verdict: mandatory for operators; insufficient as a single interface when the workflow also needs public competitor research, multichannel reporting, or custom analysis.
Kalodata — best for broad TikTok Shop market and creator research
Best for: researching external shops, products, creators, videos, LIVE activity, and competitive patterns.
Data source: Kalodata says it collects public TikTok commerce information and processes it with algorithmic models.
Answers well: which public-market entities and content patterns deserve deeper investigation.
Does not answer: a competitor’s audited revenue, settlement, or profit.
In our logged-in US review, Kalodata’s Shop Detail surface exposed fields for revenue, self-operated and affiliate revenue, items sold, average unit price, active affiliates, new affiliate videos, channel mix, and product/creator/video/LIVE drill-downs. Its Product Detail view included price, commission, shipping, items sold, creator conversion, concentration, and content-channel splits.
The interface was set to the US market but displayed currency in CNY, so we use the screenshots to verify field coverage—not to quote the amounts as US-dollar results. Kalodata also states that modelled transaction and ad-spend values may differ from actual figures and should not be used for precision settlement or performance evaluation. See Kalodata’s data-method explanation.
Verdict: useful for broad external research if the team treats displayed commerce values as market intelligence and validates major decisions elsewhere.
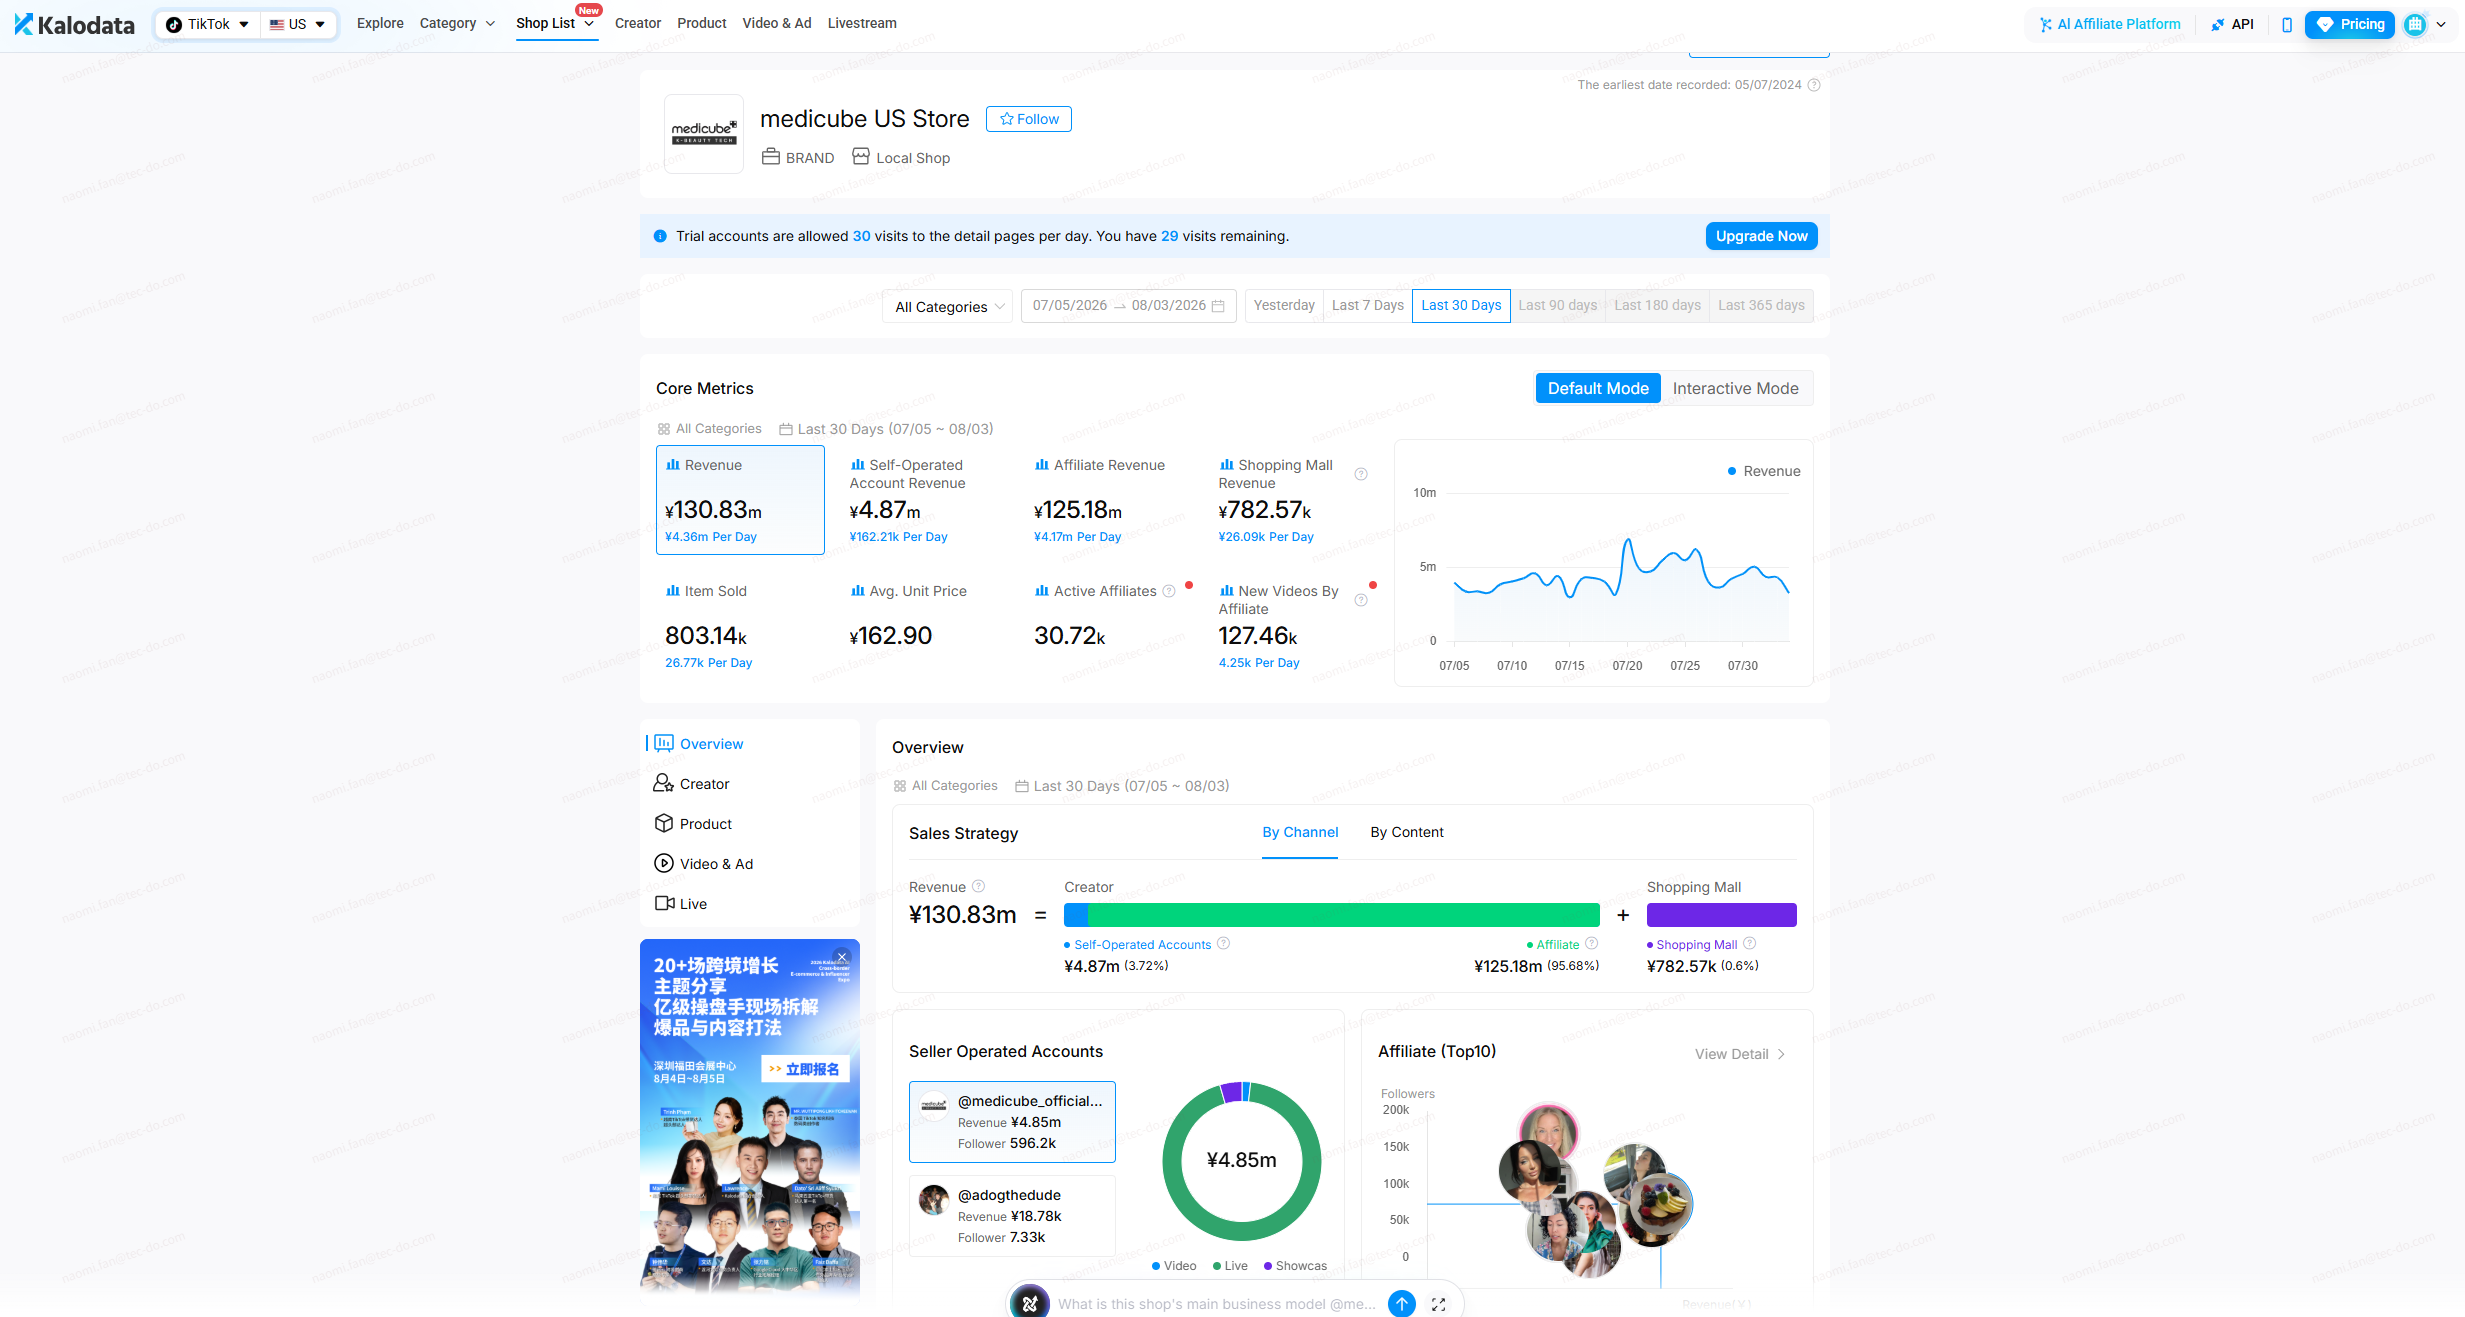
Kalodata Shop Detail, US market, last 30 days, captured August 5, 2026. The account displayed CNY, so the screenshot is used to verify field coverage—not to report US-dollar results.
FastMoss — best for deep TikTok commerce data and API workflows
Best for: teams that need broad product, creator, shop, category, video/LIVE, or API coverage.
Data source: FastMoss’s commerce-data pipeline and models.
Answers well: large-scale discovery, monitoring, entity comparison, and structured data retrieval.
Does not answer: the merchant’s first-party finance record.
The FastMoss Developer Center describes product, creator, shop, video/LIVE, and category domains, more than 45 endpoints, and request-based API access from $0.01 per call. Its public consumer-plan values did not render consistently in our research session, so we do not publish a current subscription figure here.
Verdict: strong for deep market-data and API use; confirm current SaaS pricing, market coverage, export rights, and refresh rules before committing.
Shoplus — best for product and influencer tracking
Best for: product selection, creator comparison, trend research, and competitor tracking.
Data source: external TikTok and TikTok Shop signals.
Answers well: which products or creators should enter a research shortlist.
Does not answer: exact shop finance, refunds, or settlement.
The official Shoplus pricing page displayed Basic at $39/month, Premium at $49/month, and Professional at $79/month on August 5, 2026, plus a one-day Basic VIP trial for new users. The page also uses annual-billing language, so verify the term and renewal price before purchasing.
Verdict: a clear fit for seller and agency teams focused on external product and influencer monitoring rather than connected profit.
EchoTik — best for accessible monitoring and API use
Best for: product, shop, creator, video/LIVE monitoring and lighter API workflows.
Data source: EchoTik’s structured external intelligence.
Answers well: discovery and monitoring across multiple TikTok commerce objects.
Does not answer: an exact merchant or competitor ledger.
The official EchoTik pricing page displayed a free plan and paid tiers starting at $9.90/month with annual billing on August 5, 2026. Vendor help material covers product, shop, influencer, LIVE, video, export, and API workflows.
Verdict: an accessible entry point for external monitoring. Treat sales figures as estimates and verify the current region, history, export, and request limits.
HiveHQ — best for connected TikTok Shop profit analytics
Best for: teams whose real question is contribution and profit, not public-market discovery.
Data source: HiveHQ says it pulls connected TikTok Shop data.
Answers well: product, customer, and profit views when costs and adjustments are complete.
Does not answer: broad competitor and creator intelligence.
The official HiveHQ Profit Analytics Suite page displayed a free plan for up to 250 orders, then Starter at $39/month, Growth at $99/month, Pro at $199/month, and Enterprise at $399/month on August 5, 2026.
The word “profit” still requires scrutiny. Confirm how the tool handles COGS, platform fees, creator commission, refunds, discounts, shipping, ad spend, adjustments, refresh timing, and settlement reconciliation.
Verdict: the most relevant category when GMV-to-profit visibility is the bottleneck, provided the cost model is complete.
M2E Sales Analytics — best for multichannel sales comparison
Best for: merchants comparing TikTok Shop with Amazon, eBay, Walmart, and other connected channels.
Data source: a merchant’s connected marketplace data.
Answers well: channel, market, product, order, unit, revenue, AOV, and customer comparisons.
Does not answer: public TikTok competitor or creator research.
M2E’s TikTok Shop Sales Analytics documentation covers revenue, units, AOV, orders, products, buyers, brands/categories, markets, and channel comparisons. M2E states that Sales Analytics is free for Multichannel Connect users.
Verdict: useful for multichannel operators who need a common operating view across marketplaces, not a TikTok-specific market-intelligence database.
Navos — best for connected TikTok workflows and custom file analysis
Best for: teams that need AI analysis from authorized TikTok connections or an Excel/CSV file, followed by a dashboard, explanation, or action plan.
Data source: authorized first-party data through official TikTok APIs, depending on the connected workflow and permissions, plus files the user is authorized to upload.
Answers well: TikTok advertising, shop, reporting, and custom analysis questions supported by the connected endpoints or supplied fields.
Does not answer: fields outside the granted API permissions or uploaded file; exact competitor finance still requires an appropriate external source.
The Navos product team confirms that the wider platform connects to TikTok's official APIs across advertising, shop, and related business scenarios. The Navos website publicly lists TikTok Shop and TikTok Ads among the ecommerce and advertising platforms it is designed to integrate with.
Navos is built with Tec-Do's cross-border marketing experience behind it. Tec-Do reports that it served more than 100,000 advertisers expanding globally in 2025 and publishes TikTok advertising and TikTok Shop operating cases. That experience gives Navos domain context beyond a generic spreadsheet assistant; it does not remove the need to check source permissions, metric definitions, and the evidence available in each task.
For the upload workflow, the current in-app Skill is named Excel with AI, CSV with Al, AI Data Analytics | Analyze Data 10x Faster. It is the renamed workflow previously called AI Excel Dashboard Generator; the public Skill page still uses the former name.
Navos pricing and credits observed in the app
The in-app monthly subscription screen displayed the following on August 5, 2026:
Plan | Monthly price | Credits shown |
Free | $0 | 500 daily bonus credits |
Starter | $19 | 20,000 credits instantly + 500 daily bonus credits |
Pro | $49 | 55,000 credits instantly + 500 daily bonus credits |
Max | $199 | 240,000 credits instantly + 500 daily bonus credits |
The screen labels daily bonus credits for text and reports only and presents the output counts as approximate. Credit use varies by task type and complexity. We did not capture a before-and-after balance for this run, so we do not assign it an exact credit or dollar cost.
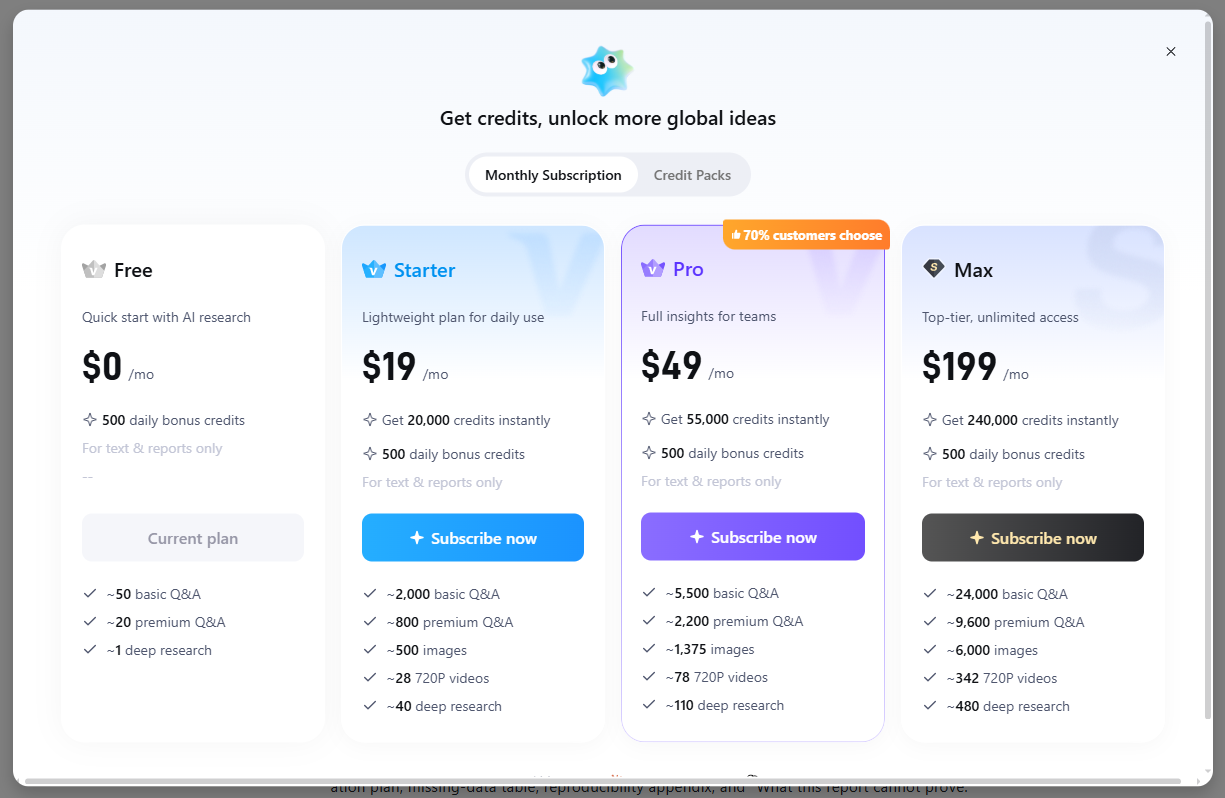
Navos monthly subscription and credit options captured August 5, 2026. Live plans can change; verify the current in-app terms before subscribing.
In our first-hand test, Navos produced a shareable HTML report in five measured minutes. The run used the Excel/CSV Skill rather than a live API connection. It audited the uploaded file before interpretation and correctly stated that this particular dataset could not support TikTok Shop sales, ad, engagement, or profit analysis.
Verdict: choose Navos when you want connected TikTok workflows or a reviewable analysis from authorized files. Treat the capabilities of the wider API-connected platform and the evidence available in one upload-only test as two separate questions.
Which TikTok Shop Analytics Tool Should You Choose?
Choose from the decision, not the logo.
If you need to… | Start with… | Add when needed |
Manage actual shop, product, creator, content, and ad performance | TikTok Shop Seller Center | Navos for authorized API-connected workflows or custom file analysis; HiveHQ for profit; M2E for multichannel |
Research competitors, products, creators, and content outside your account | Kalodata, FastMoss, Shoplus, or EchoTik | Seller Center to validate what works in your own shop |
Reconcile contribution or profit | Complete finance/cost inputs plus HiveHQ or an internal model | Seller Center and payout data as the operating source |
Compare TikTok Shop with other marketplaces | M2E Sales Analytics | A BI or file-analysis workflow for company-specific reporting |
Turn authorized TikTok data or existing exports into a weekly report with actions | Navos | Connect the appropriate official API workflow or provide first-party and finance exports with the required fields |
A minimal stack
For a small US seller, a practical minimum is:
- Seller Center for first-party performance.
- One external research tool only if competitor, creator, or category monitoring is a real recurring job.
- A consistent spreadsheet or Navos workflow—API-connected or file-based—for weekly review.
A scaled stack
A more mature team may use:
- Seller Center and Shop Ads/GMV Max as first-party sources.
- One external market-intelligence platform.
- A connected profit or multichannel layer.
- A governed reporting layer, such as an authorized Navos connected-data or file-analysis workflow, that preserves definitions, owners, and actions.
Buying multiple external tools that answer the same question creates more dashboards, not necessarily more truth.
If your main decision is what to sell rather than how your current shop is performing, use our separate comparison of TikTok Shop product research tools.
A Weekly TikTok Shop Analytics Workflow
The goal of weekly reporting is not to archive charts. It is to identify the first meaningful constraint, assign an action, and check whether the action worked.
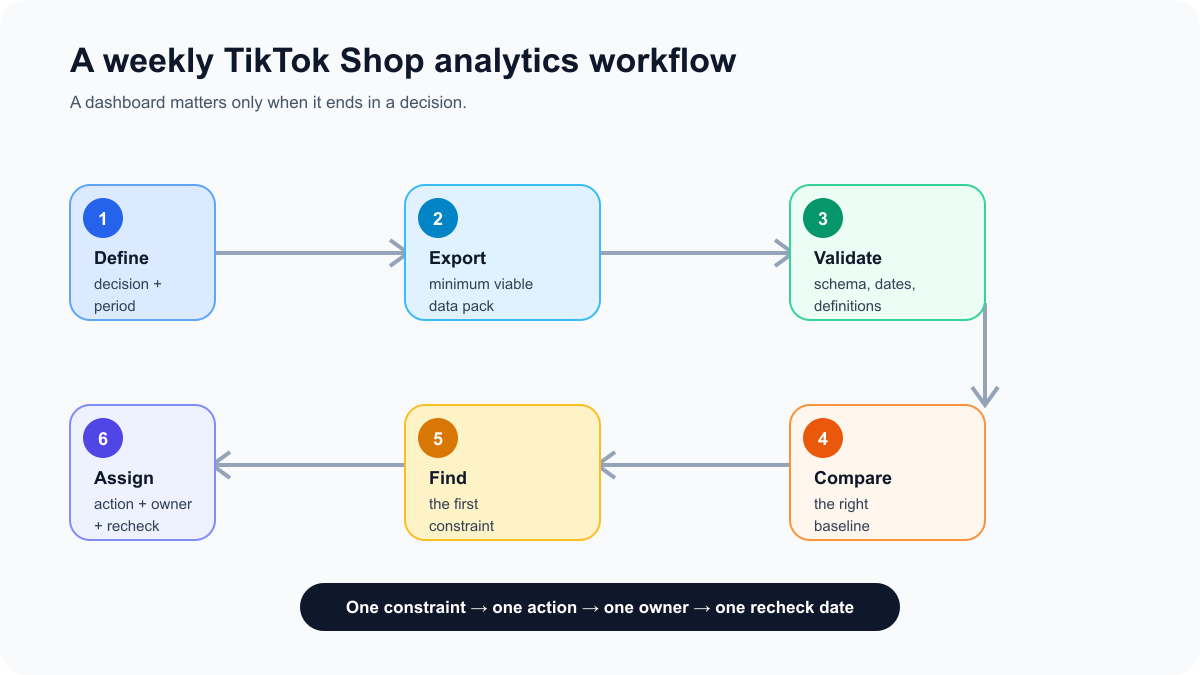
A repeatable weekly workflow: define, export, validate, compare, diagnose, and assign.
Step 1: define the decision and reporting period
Write the question before exporting data. Examples:
- Why did recognized orders fall last week?
- Which creator tests deserve another sample or commission change?
- Did paid growth improve contribution, not only GMV?
- Which products lost search or Shop Tab exposure?
Use complete, comparable periods. Record the timezone, currency, attribution window, campaign type, and any promotion or stock event.
Step 2: export the minimum viable data pack
The exact fields depend on the decision, but a useful weekly pack includes:
Shop and product performance
- date and timezone;
- product and SKU IDs;
- product/SKU name;
- impressions and product-page views;
- clicks and CTR where available;
- checkouts, orders, items sold, and AOV;
- GMV or revenue with its exact platform definition;
- cancellations, returns, and refunds.
Creator and content performance
- creator and content IDs;
- content type: video, LIVE, or other supported format;
- publish or activity date;
- views, product clicks, attributed orders/items, and attributed GMV;
- commission or sample cost when relevant.
Paid performance
- campaign and product IDs;
- campaign type and attribution settings;
- spend, impressions, clicks, product-page views, checkout, purchases, gross revenue, and ROAS/ROI;
- paid/organic inclusion rule.
Profit inputs
- recognized sales;
- product discounts and refunds;
- COGS;
- platform and payment fees;
- creator commission;
- ad spend;
- shipping/fulfillment and other adjustments.
If an export does not contain the fields needed for the question, stop. Request the missing data instead of asking an AI model to estimate it silently.
Step 3: validate the file before interpreting it
Run a data-readiness check:
- row and column counts;
- exact field names and data types;
- date coverage and granularity;
- missing values;
- duplicate rows and duplicate IDs;
- currency and locale;
- timestamp/timezone consistency;
- whether order states include cancellations or refunds;
- whether cumulative and period metrics are mixed;
- whether the file is a complete export or a sample.
This step is not administrative overhead. One wrong encoding, timezone, duplicate key, or revenue definition can change the decision.
Step 4: compare against the right baseline
Compare complete periods and similar contexts:
- last week versus the prior complete week;
- a promotion versus a comparable promotion;
- new creator tests versus other new creator tests;
- product cohorts with similar price, stock, and traffic source;
- paid-only results versus paid-only results under the same attribution logic.
Avoid interpreting cumulative views by publication month as a performance trend. Older content has had more time to accumulate exposure.
Step 5: identify the first constraint
Move through the funnel in order:
- Eligibility, stock, fulfillment, and listing health.
- Qualified impressions.
- Product clicks and interest.
- Checkout and purchase conversion.
- Cancellations, returns, and customer quality.
- Contribution after costs.
Fixing a later-stage metric while an earlier-stage constraint remains can waste time and budget.
Step 6: assign one action, owner, and recheck date
End every weekly review with a decision log:
Constraint | Evidence | Action | Owner | Recheck date | Success rule |
Product impressions fell after stock disruption | Complete-week impressions and stock history | Restore inventory and monitor eligibility | Operations | Next Monday | Impressions recover versus pre-disruption baseline |
High video views but weak product clicks | Video views, product clicks, and comparable creator cohort | Test a clearer product demonstration and CTA | Creator lead | In seven days | Product-click rate improves without weaker order quality |
GMV increased but contribution fell | Sales plus refund, commission, ad, fulfillment, and COGS inputs | Pause the lowest-contribution promotion | Growth + finance | After next complete week | Contribution improves at acceptable order volume |
Upload an authorized TikTok Shop export to Navos when you need a custom dashboard and written weekly review from the files you already own.
Hands-On Test: What a TikTok Export Can—and Cannot—Tell You
Navos supports official TikTok API connections, but this test deliberately used its Excel/CSV analysis workflow with an authorized TikTok video and creator benchmark file. It was not a Seller Center sales export, which made it a useful test of whether the upload workflow would respect the file's limits.
Test setup
- File type: CSV
- Coverage: September 2, 2025 to February 27, 2026
- Rows and fields: 293 video rows and 13 fields
- Groups: Product A, Product B, and Product C
- Measured generation time: five minutes
- Public privacy rule: product names, account identifiers, video URLs, and raw records remain private
The file contained creator, video, publication, cumulative view, follower-snapshot, region/language-label, and text fields. It did not contain GMV, orders, items sold, product clicks, conversion, spend, ROAS, fees, cost, or profit.
The prompt forced a data-readiness decision first
The critical instructions were:
Audit the uploaded file before analysis. Use only supplied fields. Separate verified values, calculated values, analytical hypotheses, and unavailable metrics. Do not infer GMV, orders, conversion, revenue, ad performance, or profit.
We also required medians, percentiles, concentration, duplicate checks, timestamp comparison, and a section called “What this report cannot prove.”
This Navos run tested the CSV-upload path, not the platform's TikTok API connections, and prohibited unsupported sales, advertising, and profit inference.
What Navos verified correctly
The report identified:
- 293 rows and 13 columns;
- 293 unique video URLs and no duplicate video rows;
- 198 unique creators;
- four missing descriptions, 14 missing region values, and 14 missing language values;
- an exact eight-hour offset between the Unix timestamp and the supplied publication date, while correctly leaving the timezone unverified;
- 111, 79, and 103 videos for Products A, B, and C;
- 87, 57, and 73 unique creators across the three groups.
It also reached the most important conclusion: the file was suitable for video/creator benchmarking and publication-volume analysis, but not for TikTok Shop sales, paid-performance, engagement, or profit analysis.
Robust metrics changed the interpretation
Cumulative views were highly skewed, so totals alone would have rewarded the group with the largest viral outlier. The report used medians, 75th percentiles, and concentration:
Anonymous group | Videos | Creators | Median views | 75th percentile | Top-one share | Top-five share |
Product A | 111 | 87 | 7,539 | 75,700 | 58% | 78% |
Product B | 79 | 57 | 997 | 3,492 | 30% | 80% |
Product C | 103 | 73 | 2,823 | 15,250 | 34% | 62% |
We independently recalculated these values from the source file; they matched the Navos report after display rounding.
The decision was not “Product A wins.” Product A had the strongest typical and upper-quartile view counts, but 58% of its group views came from one video. Product B’s top five videos accounted for 80% of its views. Product C had a lower median than Product A but the least concentrated top-five share of the three.
These are content-distribution signals within the supplied sample. They do not prove product demand, sales, market share, creator quality, or causality.
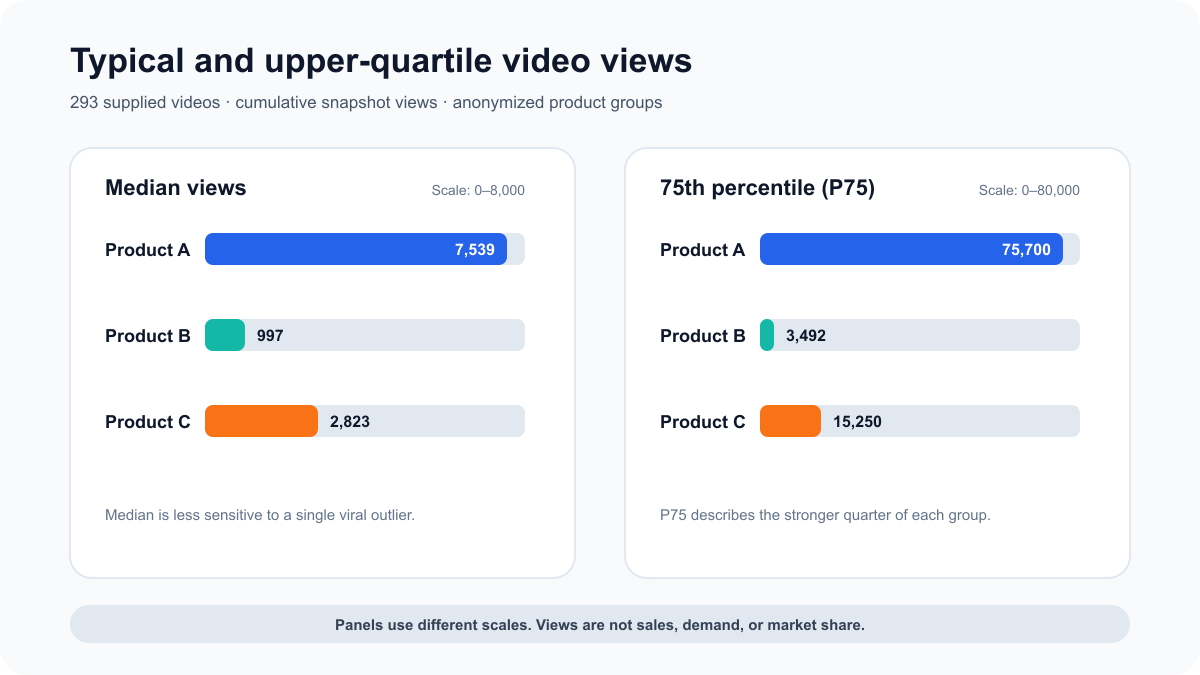
Median and P75 views reduce the influence of a single outlier. Each panel uses its own scale.
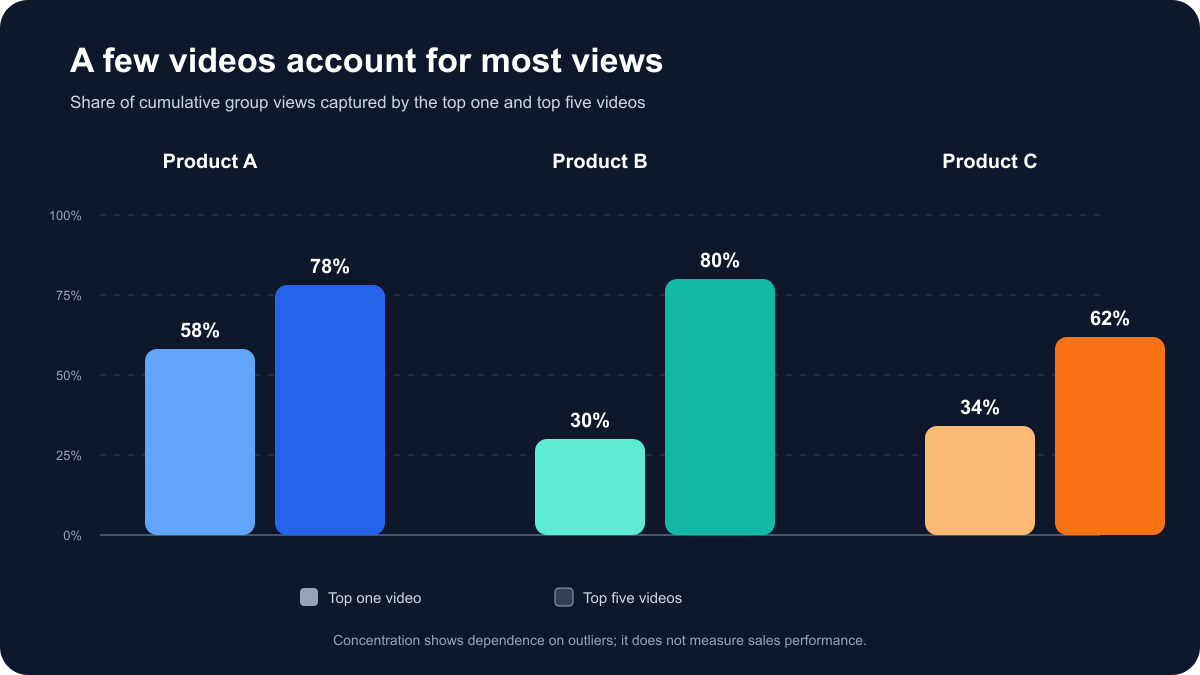
View concentration shows how dependent each group is on a few videos; it does not measure sales performance.
Why AI Reports Still Need Data-Quality Checks
In this test, the source CSV used GBK/GB18030 encoding, but the report did not identify the text encoding correctly, causing some punctuation errors. Its content-theme categories also did not include a reproducible keyword dictionary. We therefore excluded the theme analysis and used only the numerical findings that we independently recalculated from the source file.
This does not affect the verified video counts, creator counts, medians, percentiles, or concentration metrics. It does show that an AI-generated report still needs checks for file encoding, field definitions, and classification rules. Before using the text-theme analysis, the file should be converted to UTF-8 and the classification method should be documented so the result can be reproduced.
What the report requested next
To answer actual TikTok Shop performance questions, the next export would need:
- product/SKU identifiers;
- a defined reporting period and timezone;
- GMV/revenue plus its definition;
- orders and items sold;
- product impressions, clicks, checkout, and conversion fields;
- creator/content attribution fields;
- Shop Ads or GMV Max spend and attribution settings;
- refunds, commissions, fees, fulfillment, and COGS for profit analysis.
This five-minute test showed the value of file analysis without pretending that every CSV is a sales dataset. Try the Navos Excel AI Dashboard workflow with an export you are authorized to use, then check whether the output distinguishes evidence from unavailable metrics.
Common TikTok Shop Analytics Mistakes
Treating modelled competitor GMV as audited sales
Third-party market-intelligence tools can be useful for ranking hypotheses and identifying entities to investigate. Their figures should not be used for settlement, precise financial evaluation, or claims about a competitor’s exact revenue unless the underlying source supports that use.
Treating GMV or ROAS as profit
GMV is a transaction-value metric under a platform definition. ROAS compares attributed revenue with ad cost. Neither subtracts every refund, commission, fee, fulfillment expense, and product cost by default.
Mixing paid, organic, affiliate, and total-channel attribution
Two dashboards may both say “revenue” or “ROI” while including different orders. Record the attribution method before comparing them.
Comparing incomplete and complete periods
Today, the last seven rolling days, a complete calendar week, and a promotion window are different periods. Use a defined cutoff and note processing delays.
Ignoring post-purchase quality
Orders can rise while cancellations, refunds, support load, and contribution deteriorate. Review commercial quality with top-line growth.
Reading cumulative content views as a time trend
Older videos have had more exposure time. Use a defined measurement window or exposure-normalized analysis before calling one publication month stronger.
Building a dashboard without a decision owner
A report without an action, owner, and recheck date is an archive. The weekly decision log is the product of the meeting; the charts are evidence.
For a broader reporting method, see Navos’s data analysis report guide.
Frequently Asked Questions
What is the best TikTok Shop analytics tool?
For your actual shop performance, start with TikTok Shop Seller Center. Use Kalodata, FastMoss, Shoplus, or EchoTik for external market research; HiveHQ for connected profit analysis; M2E for multichannel sales comparison; and Navos for authorized TikTok API-connected workflows or CSV/XLSX analysis. There is no credible universal winner across all these data sources.
Is TikTok Shop Seller Center analytics enough?
It is the essential first-party baseline. It may not be enough if you need broad competitor intelligence, complete profit analysis, cross-marketplace comparison, or a custom weekly report that combines multiple exports.
Can you see competitors’ exact TikTok Shop sales?
Usually not through third-party market-intelligence products. They may estimate or model product/shop commerce activity from public signals. Use those values to prioritize research, not as audited competitor financials.
How accurate are Kalodata, FastMoss, Shoplus, and EchoTik?
Accuracy varies by metric, market, refresh timing, coverage, and method. Verify each vendor’s current methodology and compare critical figures with first-party data where possible. Do not assume all displayed sales or GMV values are exact.
Which TikTok Shop metrics should sellers track every week?
Track a small set across the funnel: qualified impressions, product clicks/CTR, checkout or purchase conversion, orders/items, AOV, cancellations/refunds, creator/content contribution, paid spend and attributed revenue, and contribution after complete costs. The exact set should match the week’s decision.
How do you export TikTok Shop analytics data?
Export availability depends on the current Seller Center module and permission level. TikTok currently documents XLS export in areas including Shop Tab & Search Analytics and export options in Product Traffic Analysis. Record filters, period, timezone, currency, and metric definitions with every export.
What is the difference between GMV, gross revenue, and profit?
GMV and gross revenue are platform-defined transaction or attributed-revenue measures; TikTok documents differences between Seller Center GMV and Ads Manager gross revenue. Profit subtracts the relevant refunds, discounts, fees, commission, ad spend, fulfillment, cost of goods, and adjustments under a stated accounting method.
Can AI analyze a TikTok Shop Excel or CSV export?
Yes—if the file contains the fields required for the question. A reliable workflow audits schema, dates, duplicates, missing values, currency, timezone, and metric definitions first. It should refuse to invent GMV, conversion, ad, or profit metrics that are absent.
Does Navos connect directly to TikTok Shop?
Yes. The Navos product team confirms that Navos connects to official TikTok APIs across advertising, shop, and related business scenarios, and its public site lists TikTok Shop and TikTok Ads among supported platform integrations. This hands-on test did not call those APIs; it validated the separate CSV-upload workflow. Available data still depends on account authorization, endpoint coverage, and the fields supplied to the task.
Final Recommendation
Build your TikTok Shop analytics stack in this order:
- Start with first-party Seller Center data and current metric definitions.
- Add one external intelligence tool only for market questions your own account cannot answer.
- Add connected finance or multichannel data when profit or cross-channel comparison is the decision.
- Audit every export before interpretation.
- End each weekly review with one action, one owner, and one recheck date.
The winning dashboard is not the one with the most metrics. It is the one whose data source matches the decision and whose output changes what the team does next.
Ready to turn an authorized export into a reviewable weekly report? Upload your TikTok Shop CSV or Excel file to Navos.