
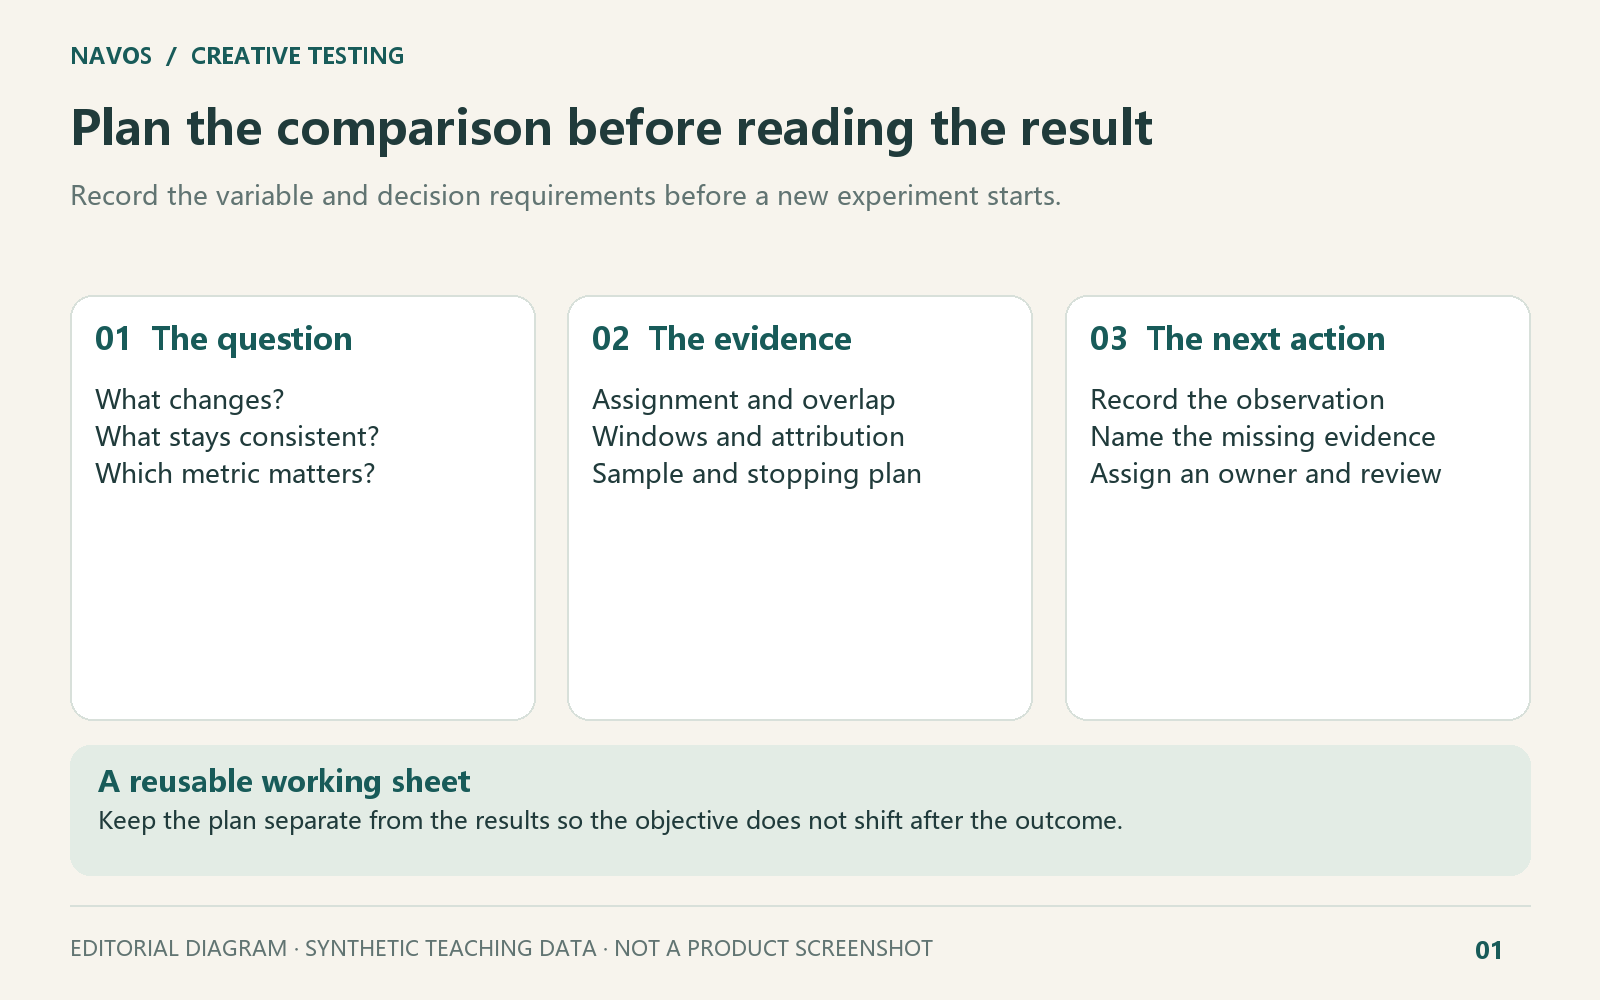
A useful TikTok creative testing template connects four things: the change you want to test, the conditions you hold steady, the metric that matters, and the evidence needed for your next decision. Start with two clearly labeled ads and one question. Then check whether the results actually answer it.
That last step matters. One ad can attract more clicks while costing more per purchase. Another can look better because it reached a different audience or offered a discount. A third comparison may simply be too early to read.
Below is a copyable planning table, a results sheet structure, and three worked examples. We also used Navos Diagnose Creative Performance to turn six fictional ad records and their test context into a report, a metrics CSV, and a planning CSV. The reviewed outputs show how a structured review can bring calculations, comparison gaps, and next actions together. The examples are teaching simulations, not live campaign results or performance benchmarks.
Copy this two-ad testing plan
Create one plan per comparison. Keep the plan separate from the results, so a number you see later does not quietly become the objective you claim to have chosen earlier.
Planning field | What to enter | Example for a hook test |
Test ID and owner | A stable identifier and a named reviewer | HOOK-01; your media buyer |
Hypothesis | One expected change in a business metric | A result-first opening may lower purchase CPA |
Variants | Ad IDs, creative files, and version names | A: problem-first; B: result-first |
Variable | Exactly what changes | Opening three seconds |
Controls | What must stay consistent | Body, CTA, offer, page, audience eligibility, format, bid and budget settings |
Primary metric | One metric selected before launch | Purchase CPA |
Diagnostics and guardrails | Supporting metrics and acceptable downside | CTR, CVR, ROAS; acceptable cost/risk limits |
Assignment evidence | How groups are created and kept separate | Experiment configuration and delivery records |
Measurement | Dates, timezone, attribution window, event definition | Same window, currency and purchase definition |
Analysis and sample plan | Method, meaningful effect, power and sample basis | Designed before launch; not guessed from a universal conversion count |
Stop and review rules | Collection limits and requirements for a conclusion | Time/resource cap, sufficient evidence, attribution completeness |
Result and next action | Observation, uncertainty, owner, next check | Describe, investigate, redesign, or validate in a new test |
If you still need to specify the footage, use a TikTok ad creative brief to give production a clear handoff. The brief defines what to make; this sheet records how the comparison will be assessed.
For a results tab, copy this CSV header. Keep a row for each variant and use
UNKNOWN for unavailable values:test_id,variant,ad_id,creative_version,market,currency,observation_start,observation_end,timezone,data_as_of,spend,impressions,destination_clicks,attributed_purchases,attributed_revenue,attribution_window,attribution_state,source_reference
These are recommended operating fields. Our six-row test used 15 source columns; ad IDs, creative versions, the data-as-of timestamp and source references are useful additions for your own records. Do not fill them with invented evidence.
Make the question specific enough to answer
“Which ad is better?” hides several different questions. You might be comparing complete concepts, refining a hook, checking a call to action, or deciding whether to commission another creator. Choose the decision first.
For a hook comparison, write something such as: “With the same video body, offer and audience conditions, will a result-first opening produce a lower purchase CPA than a problem-first opening?” Keep the rest of the video unchanged. If you replace the presenter, rewrite the offer and change the page as well, you have a broader package comparison. You cannot isolate the opening's contribution.
Record the ad format too. Changing from a non-Spark upload to a Spark Ad can introduce differences beyond the opening. Our Spark Ads vs non-Spark Ads comparison helps identify the format choices to document before testing.
Budget settings and spend need separate columns. Equal configured budgets do not prove equal delivery, while different realized spend does not by itself prove that the budgets were configured differently. Save both the settings and the outcome.
Separate a controlled experiment from a campaign review
A normal delivery report can reveal useful patterns. It does not automatically establish random assignment or mutually exclusive groups. Label that evidence as an observational comparison unless you have the experiment records to support a stronger claim.
TikTok's Split Testing documentation, reviewed on October 26, 2026, describes choosing one test variable and includes compatibility restrictions. Its compatibility table lists TikTok Shop as unsupported. Check the exact campaign type, objective, settings and account availability before using the tool; do not carry a generic Split Test procedure over to Shop or GMV Max.
The worksheet can organize either kind of evidence. Its “assignment evidence” field should tell the reviewer which kind they are reading.
Calculate the same metrics with the same definitions
Pick the primary metric before launch. In the examples below, it is purchase CPA, calculated from ad spend and attributed purchase events. CTR is a diagnostic, not a substitute objective chosen after seeing the result.
Metric | Calculation | What to check |
Destination CTR | Destination clicks ÷ impressions × 100 | Do not substitute all clicks or engagements |
CPC | Spend ÷ destination clicks | Use the same click definition |
CPM | Spend ÷ impressions × 1,000 | Keep currency consistent |
Click-to-purchase CVR | Attributed purchase events ÷ destination clicks × 100 | Event counts are not necessarily unique buyers |
Purchase CPA | Spend ÷ attributed purchase events | A zero or unknown denominator needs a reason, not a fabricated cost |
ROAS | Attributed revenue ÷ spend | Revenue is not profit; state refund and revenue treatment |
This CVR is a defined ratio for the supplied records. Without matching event definitions and an attribution window, two columns with the same label may not describe the same thing. Purchase events also do not establish that every click is an independent trial with exactly one possible purchase, so a spreadsheet of these totals is not enough to justify a generic significance calculation.
For multiple days, sum the relevant numerators and denominators within the same variant and compatible window before calculating the rate. Do not take an unweighted average of daily CTRs when daily impressions differ. Keep different experiments separate.
Three comparisons, three different decisions
The following examples came from the supplied-data Navos test. They concern fictional US website-conversion records in USD. They are independent cases, not three rounds of one campaign. Source labels and assumptions remain visible so the arithmetic can be reviewed without treating the scenario as a real platform experiment.
Example 1: More clicks, but a higher purchase CPA
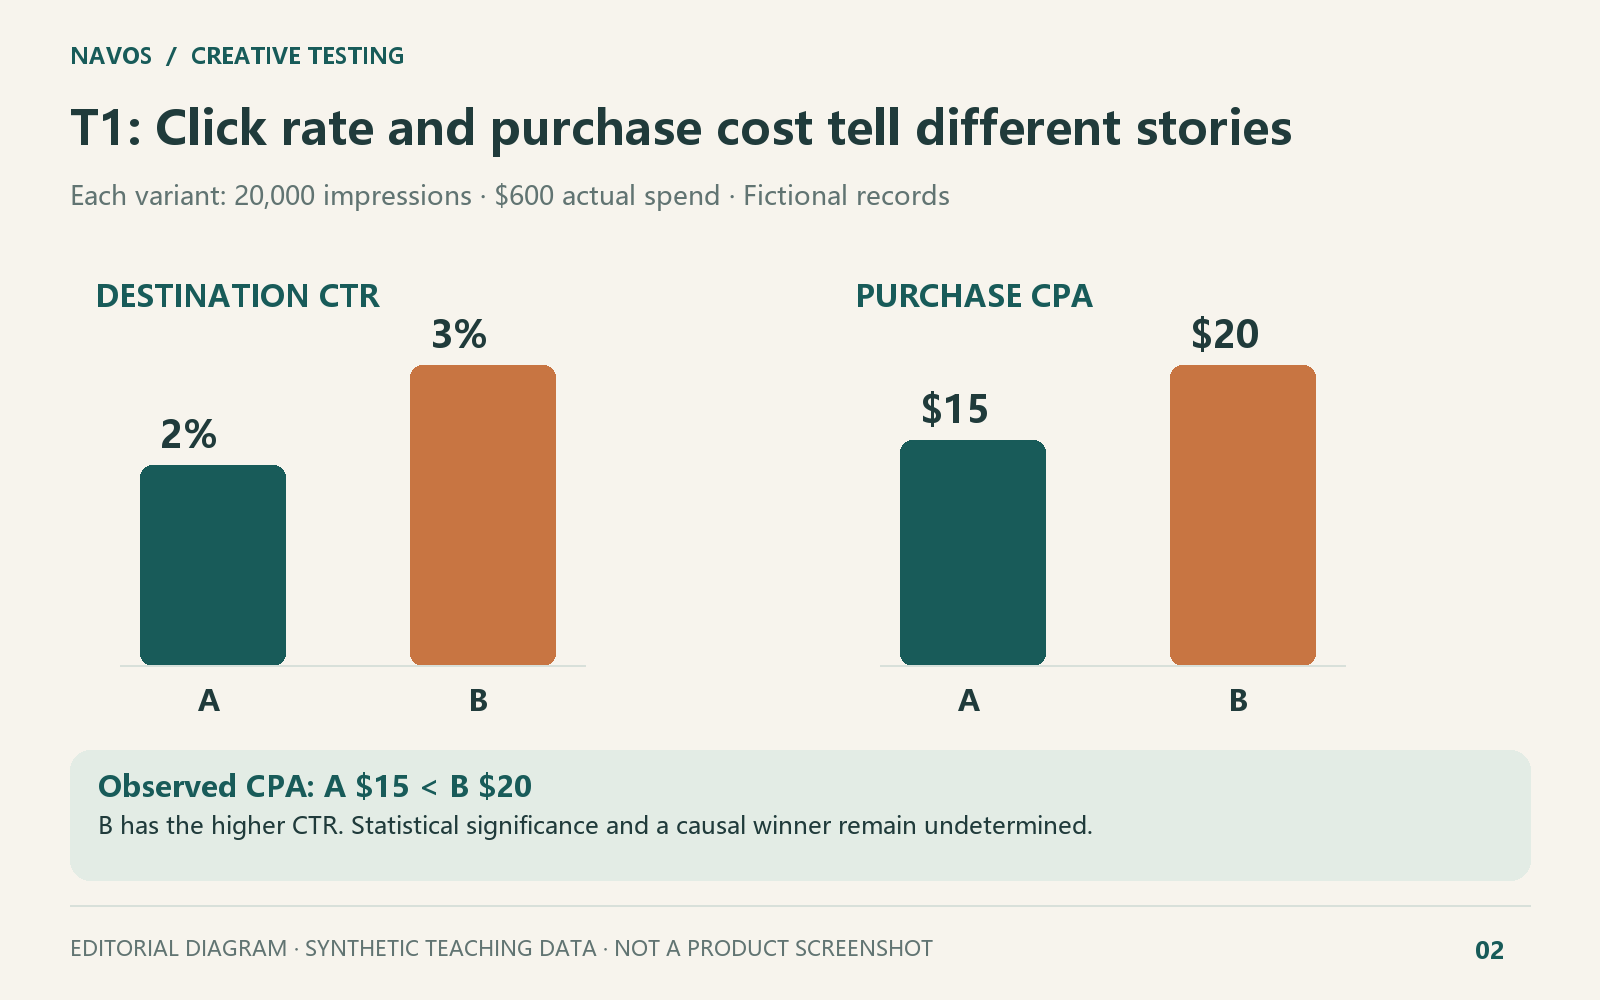
Case T1 describes a planned comparison that changes only the opening. Both ads have 20,000 impressions and $600 in spend. The context describes consistent controls, but no execution logs or statistical result are supplied.
Result | Ad A | Ad B |
Destination clicks | 400 | 600 |
Attributed purchases | 40 | 30 |
Attributed revenue | $2,000 | $1,500 |
Destination CTR | 2.00% | 3.00% |
CPC | $1.50 | $1.00 |
Click-to-purchase CVR | 10.00% | 5.00% |
Purchase CPA | $15.00 | $20.00 |
ROAS | 3.33 | 2.50 |
B has more clicks and a lower CPC. A has the lower observed purchase CPA, the metric chosen for this exercise. That is a useful distinction to bring into a creative review: the click leader and the purchase-cost leader can be different ads.
The next action is to verify the assignment and measurement evidence before making a stronger claim. These totals do not establish a statistically significant winner or prove why the difference occurred. Navos's reviewed comparison keeps the observed direction and the missing evidence together, giving the team a more useful handoff than a single “best ad” label.
Example 2: Better numbers, but several things changed
In T2, Ad A uses a broad audience, no discount, landing page L1 and a $100 daily budget setting. Ad B uses a remarketing audience, a 10% discount, page L2 and a $150 daily budget setting. The opening and date window also differ. The observation windows overlap for four days, but are not identical.
B's observed CPA is $10, versus A's $15. Its reported ROAS is 5.00, versus 3.33. Those are valid arithmetic comparisons of the supplied values. They do not tell us how much of the gap came from the hook, audience, offer, page, budget or timing.
The useful output is a redesign plan: hold audience, offer, page, budget rules, format and observation window consistent, then change the hook. Treat the existing figures as exploratory context. Do not describe remarketing or the discount as the proven cause of B's result.
The example also contains source questions worth carrying into the review: the discount and revenue treatment need clarification, and the supplied
complete attribution label is a simulation flag rather than independent proof of elapsed reporting time. Keep the reported values while flagging the questions; do not “fix” revenue by assuming how the offer was redeemed.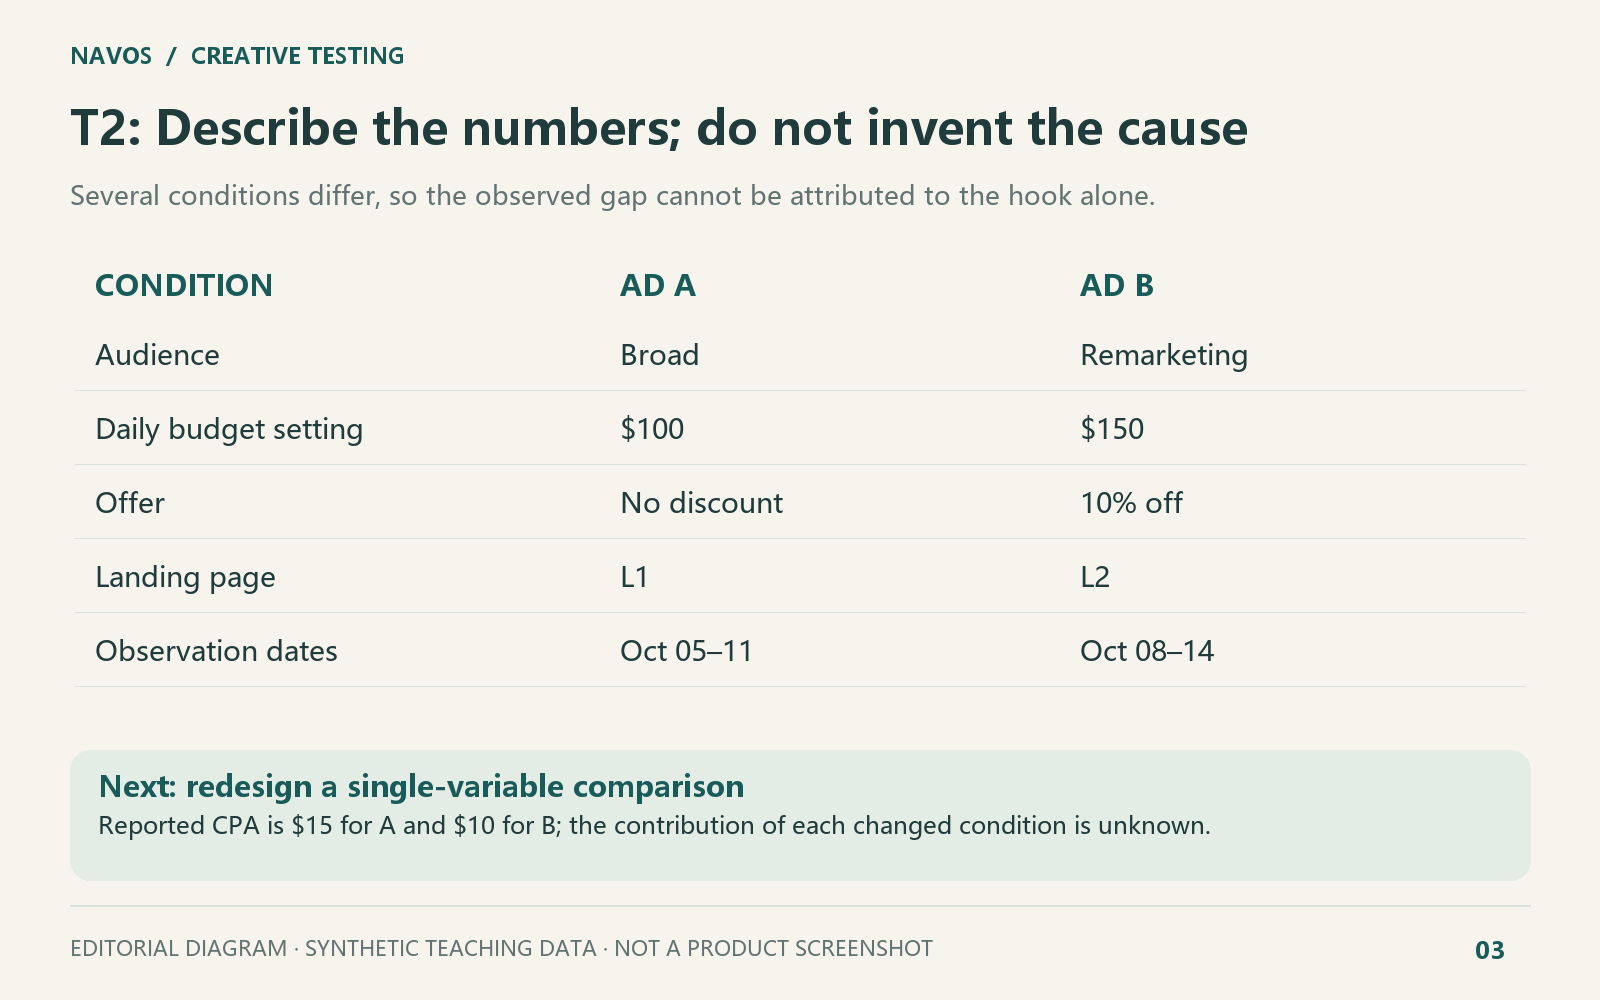
Example 3: Zero purchases and unknown purchases are different
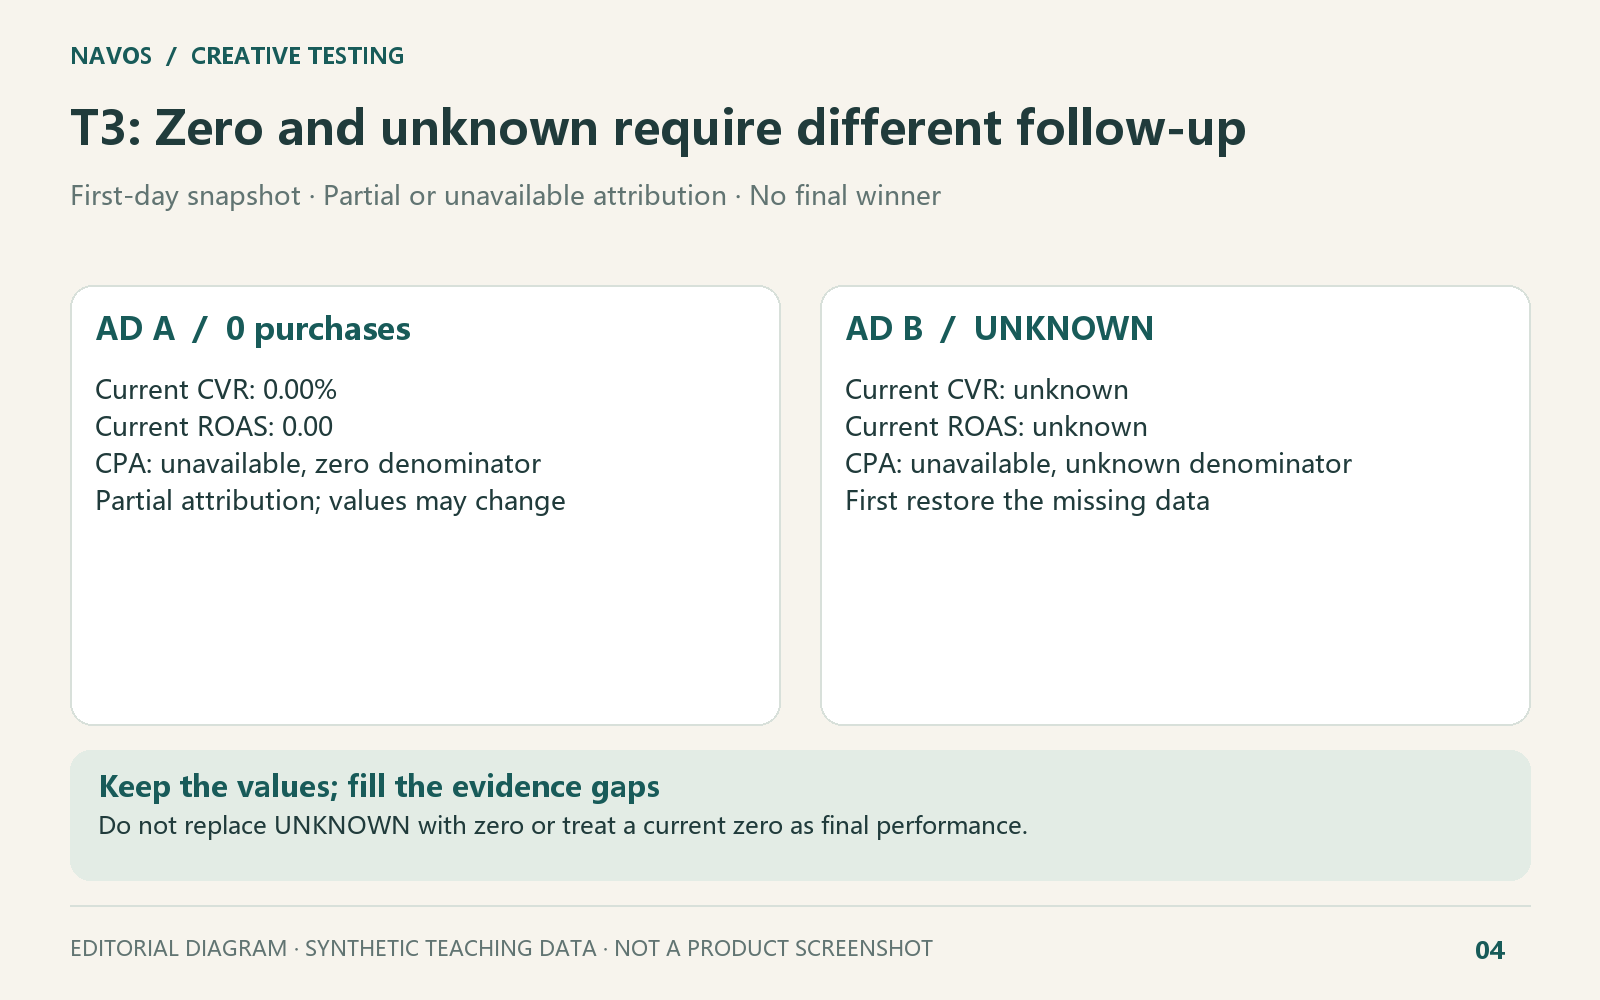
T3 is a first-day snapshot. A has $18 in spend, 12 clicks and zero reported purchases. B has $21 in spend, 21 clicks and unavailable purchase and revenue values. A's attribution is partial; B's conversion data is unavailable.
Result | Ad A | Ad B |
Current purchase count | 0 | UNKNOWN |
Current CVR | 0.00% | Unknown |
Current purchase CPA | Not calculable: zero denominator | Not calculable: unknown denominator |
Current ROAS | 0.00 | Unknown |
Next action | Recheck after attribution backfill | Restore the missing data, then recheck |
The current zero values for A can be reported. They are not final performance conclusions. Partial attribution means values may change; it does not prove that delay caused the zero. B's unknown values cannot be replaced with zero.
Use the planned window and attribution settings to schedule another review, then confirm reporting completeness. A calendar date alone does not make missing data complete. If a new confirmatory experiment is needed, define its design before that new experiment starts. Adding rules after inspecting this snapshot does not make them pre-specified for the same data.
Use Navos to turn the export into a review pack
The practical challenge is assembling a decision record from different inputs: performance columns in one file, test settings in another, and unanswered questions in chat. Navos can help bring those pieces into a report your team can review.
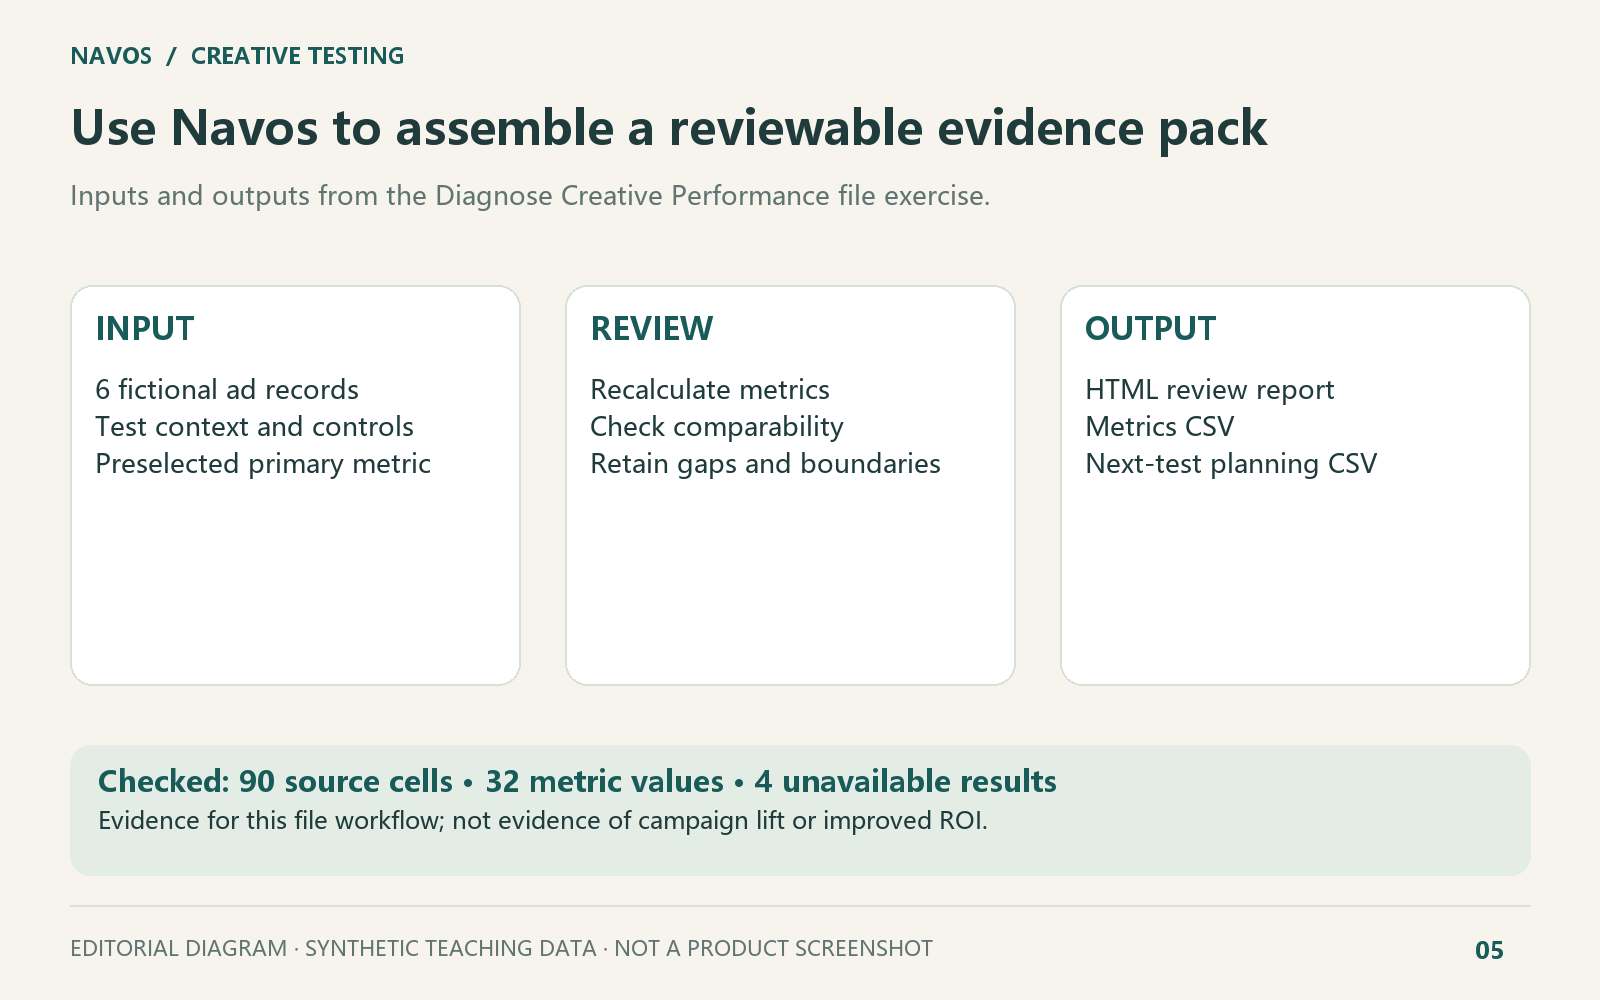
In our controlled file exercise, Diagnose Creative Performance produced an HTML report, a metrics CSV and a test-plan CSV. Independent checks of the reviewed output matched all 90 original data cells, 32 calculable metric values, and four not-calculable results across the six records. These checks validate this supplied-data workflow; they do not measure campaign lift.
The value is visible in what each output gives the team:
Output | What it brings together | How a team can use it |
Review report | Results, comparison conditions, gaps and next actions | Brief the buyer and creative lead from the same evidence |
Metrics CSV | Source fields, computed values and formulas | Check the numbers and reuse them in a working sheet |
Test-plan CSV | Controls, missing design inputs, ownership and follow-up | Prepare the next comparison without losing the current lesson |
The marketer still checks the source data and approves the experimental design. Navos's role in this exercise was to organize the analysis and its next steps; it did not connect to an ad account or launch an experiment.
To try the workflow, download Navos and prepare your first creative review. In Square, look for Diagnose Creative Performance, the Skill used in this test, and confirm its current availability in your client. Supply an authorized, anonymized export and a short note describing the setup.
A prompt to use with your own files
Review the attached two-ad performance export and test-context note.
Confirm the files and row counts before analyzing them.
Keep all source fields. Recalculate destination CTR, CPC, CPM,
click-to-purchase CVR, purchase CPA and ROAS with explicit formulas.
Keep unknown values separate from zero and explain missing results.
Check which settings changed, the observation windows, assignment
evidence and attribution completeness. Use the preselected primary
metric; separate observed differences from causal or statistical claims.
Return a review report, a metrics CSV and a next-test planning CSV.
Leave unsupported design assumptions blank and identify the next action
and owner. Do not connect to or change an ad account.
Include both the performance export and the context. A CSV of spend and clicks cannot reveal an unrecorded landing-page change. Remove unnecessary personal or account-identifying information before sharing files.
Turn the review into the next creative decision
End each comparison with an observation, a limitation and an action. For T1, the observation is that A has the lower reported CPA. The limitation is unverified experiment execution and missing statistical evidence. The action is to prepare a properly designed validation if that decision warrants additional spend.
For T2, the action is to redesign the comparison. For T3, it is to repair the data gap and wait for the planned measurement window to become interpretable. Neither needs a forced winner.
If you are reviewing a creative that used to perform well and is now declining, start with the creative fatigue checks. That diagnosis answers a different question from testing a new challenger.
Give the next action an owner and a review date. Keep the creative version, raw snapshot, calculation definitions and decision note together. This gives the next buyer or creative lead a record they can use without reconstructing the reasoning from messages.
Frequently asked questions
How many creatives should I test at once?
For the comparison in this template, use two versions and one defined question. A wider creative-screening program can involve more assets, but its delivery patterns should not be mistaken for a controlled two-group experiment. Choose a scope your budget and measurement plan can support.
How long should a TikTok creative test run?
TikTok's current create-a-split-test help page recommends scheduling at least seven days. Treat that as platform setup guidance. Your planned analysis, event volume, business cycle and attribution completeness determine whether the result is interpretable. Reaching a time or resource cap may end collection with an inconclusive result.
How much budget do I need?
There is no dollar amount in this worksheet that guarantees a winner. Use your baseline, the effect you need to detect, the chosen metric and analysis method, and the eligible platform's planning tools where available. If the design is unaffordable, narrow the question or keep the work exploratory; do not invent certainty from a smaller sample.
Should I choose the ad with the highest CTR?
Use the primary metric selected for the business question. In T1, B has the higher CTR while A has the lower observed purchase CPA. CTR helps describe the path to a result, but it cannot replace a purchase-cost objective after the fact.
Can I use this for TikTok Shop or GMV Max?
You can adapt the recordkeeping fields to review exports, provided the event definitions and reporting conditions are clear. That does not make the platform's generic Split Test feature available for those campaigns. Check the applicable product's current experiment capabilities and account settings separately.
Can Navos identify a winning ad automatically?
In this exercise, Navos organized metric comparisons, evidence gaps and next actions from supplied files. That helps a team reach a better-supported decision. A causal or statistically significant winner still requires a suitable experiment and valid analysis; a generated report alone does not supply either.
Bring your export, test context and primary metric into the same review. Use Navos to build your creative testing review pack, then decide whether to validate a promising direction, redesign the comparison or collect the missing evidence.