
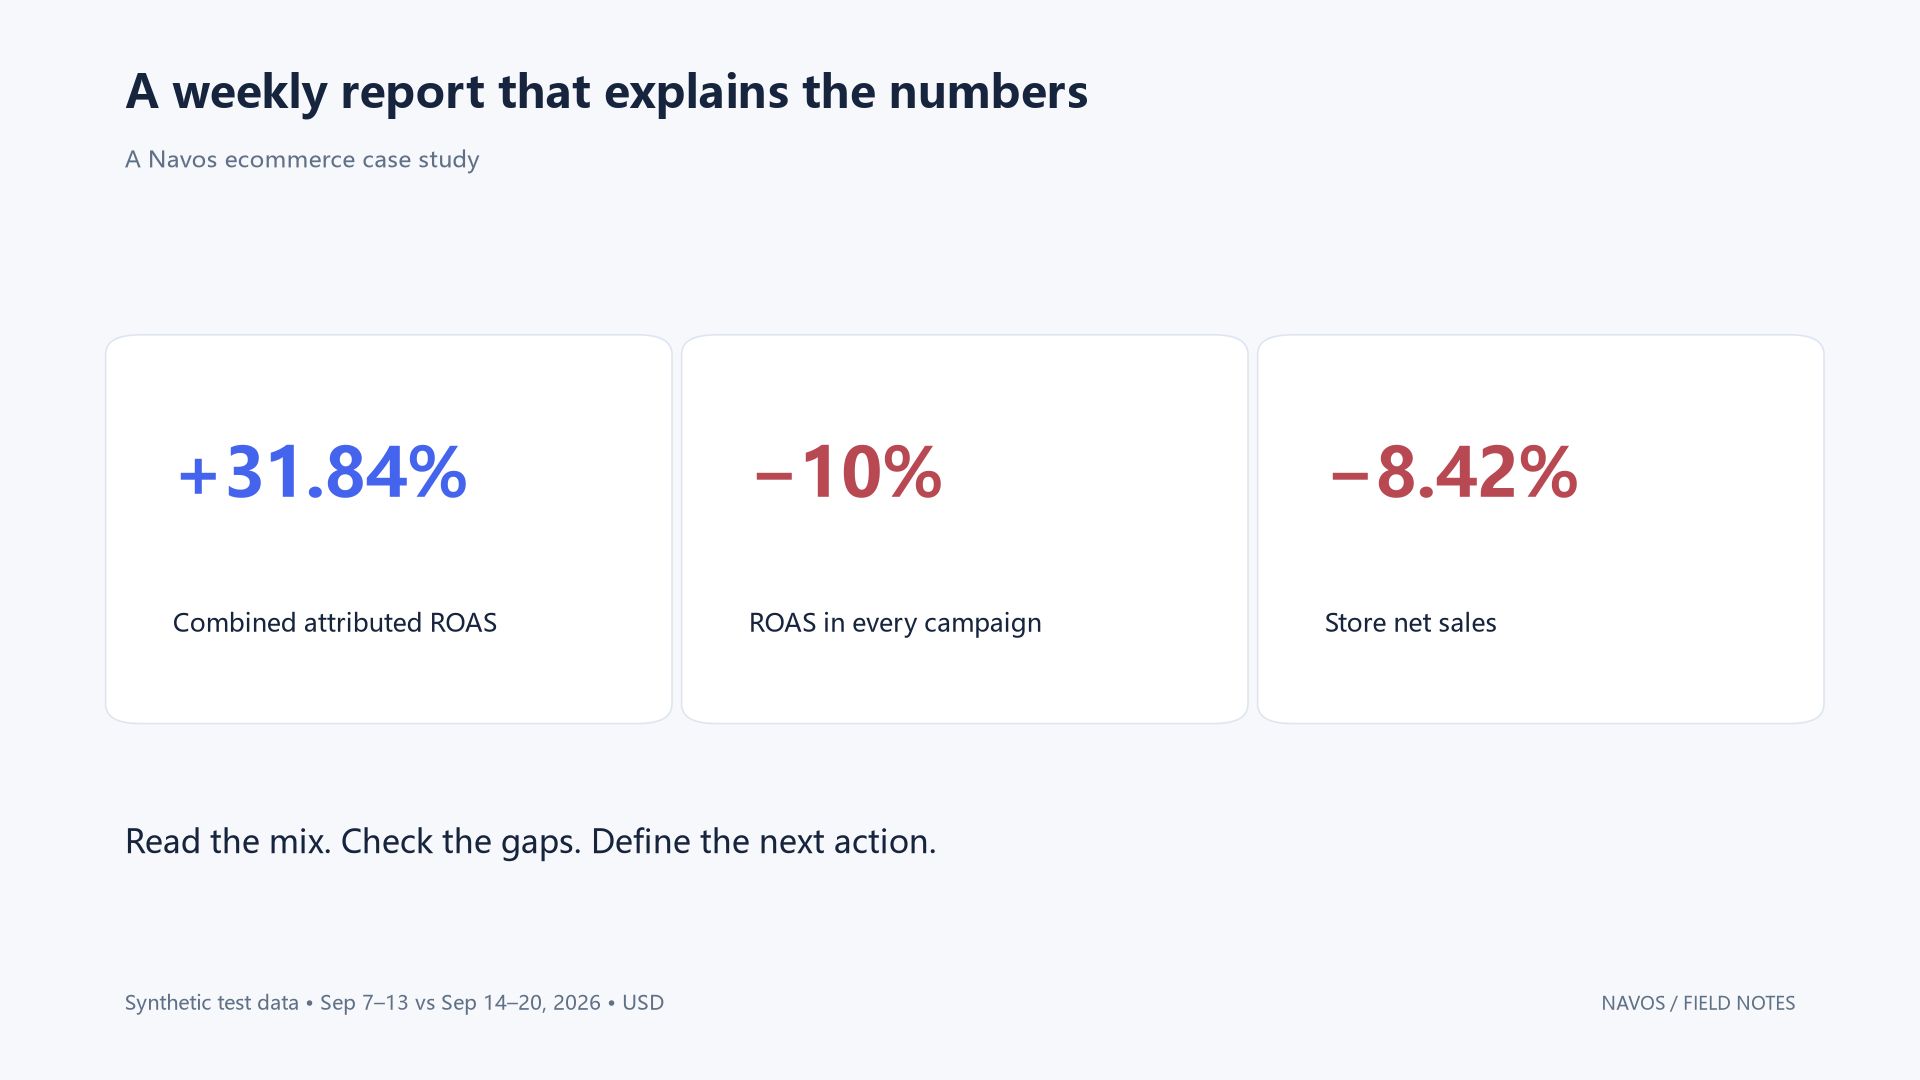
Your combined advertising ROAS is up 31.84%. Every campaign's ROAS is down 10%. Store net sales have fallen 8.42%. What belongs in the weekly update—and would any of those numbers justify increasing the budget?
A useful weekly marketing report for ecommerce connects campaign results with store sales, checks whether the comparison is complete, and names the evidence needed for the next decision. A summary of green and red arrows cannot do that on its own.
We tested this workflow in Navos using a controlled dataset with Google and TikTok campaign labels, a separate store sales ledger, and deliberate data quality problems. The accepted report explained the conflicting trends and translated them into follow-up work for marketing, operations, and finance. Here is the report structure, the calculations behind it, and how to try the same kind of review.
What this Navos test covered
We used the PC Skill
business-review-campaign-performance-review, version 1.0.0, under Square → Operational Reports. The task was to compare the two latest complete weeks and assess whether the supplied evidence supported a budget increase.The inputs were three files:
Input | Contents | Why it matters |
Campaign daily CSV | Date, platform, campaign ID, spend, impressions, clicks, purchases, and attributed revenue | Supports campaign and weekly calculations |
Store daily CSV | Gross product sales and refunds booked each day | Provides a separate view of store sales |
Data dictionary | Currency, timezone, reporting periods, definitions, and missing-value rules | Defines what can be combined and compared |
All records were synthetic, with USD amounts and an America/New_York reporting timezone. They were designed to test interpretation, not to represent a real merchant's performance. We compared September 7–13 with September 14–20, 2026, and kept September 21–22 separate as an incomplete week.
The result discussed here is version 4, produced after three rounds of explicit feedback. Earlier versions required corrections; the business action table was also an added requirement. An independent audit recalculated the exported metrics from the original inputs and reproduced the final HTML report and CSV by running the submitted script unchanged.
ChatGPT received the same initial inputs and prompt as a reference run. Navos's revised output had additional feedback and an expanded brief, so this article does not treat the final version as a like-for-like first-run victory. We did not measure speed, time saved, or real business gains.
A weekly marketing report template you can reuse
Use six sections to make the report useful in a review meeting. The last column shows how this case fills each section.
Section | What to include | Example from this test |
Executive summary | The main change, its qualification, and the open decision | Combined attributed ROAS rose, but store net sales and each campaign's ROAS fell |
Weekly scorecard | Complete-period totals, formulas, and comparison dates | Both weeks spent $14,000; net sales fell from $33,250 to $30,450 |
Campaign breakdown | Campaign results alongside spend allocation | More spend went to brand search and retargeting |
Data quality notes | Duplicates, missing fields, coverage, and partial periods | One campaign-day purchase count was unavailable |
Business interpretation | What the evidence establishes and what it leaves unresolved | The mix explains the aggregate ROAS increase arithmetically; profit remains unknown |
Next actions | Owner, required evidence, and decision to revisit | Reconcile attribution, examine customer mix, and obtain costs before assessing expansion |
For a cross-border team, agree on the reporting currency and timezone before building this scorecard. If your files contain several currencies or markets, define how they will be separated or converted. This particular test used one currency and one market; it did not validate a currency-conversion workflow.
Read the store scorecard alongside platform ROAS
The first comparison looks encouraging if you only read the advertising platform totals.
Metric | Sep 7–13 | Sep 14–20 | Change |
Total ad spend | $14,000 | $14,000 | 0% |
Sum of platform-attributed revenue | $39,900 | $52,605 | +31.84% |
Combined platform-attributed ROAS | 2.8500 | 3.7575 | +31.84% |
Store gross product sales | $35,000 | $32,900 | −6.00% |
Refunds booked in the period | $1,750 | $2,450 | +40.00% |
Store net sales | $33,250 | $30,450 | −8.42% |
Store net sales / ad spend | 2.375 | 2.175 | −8.42% |
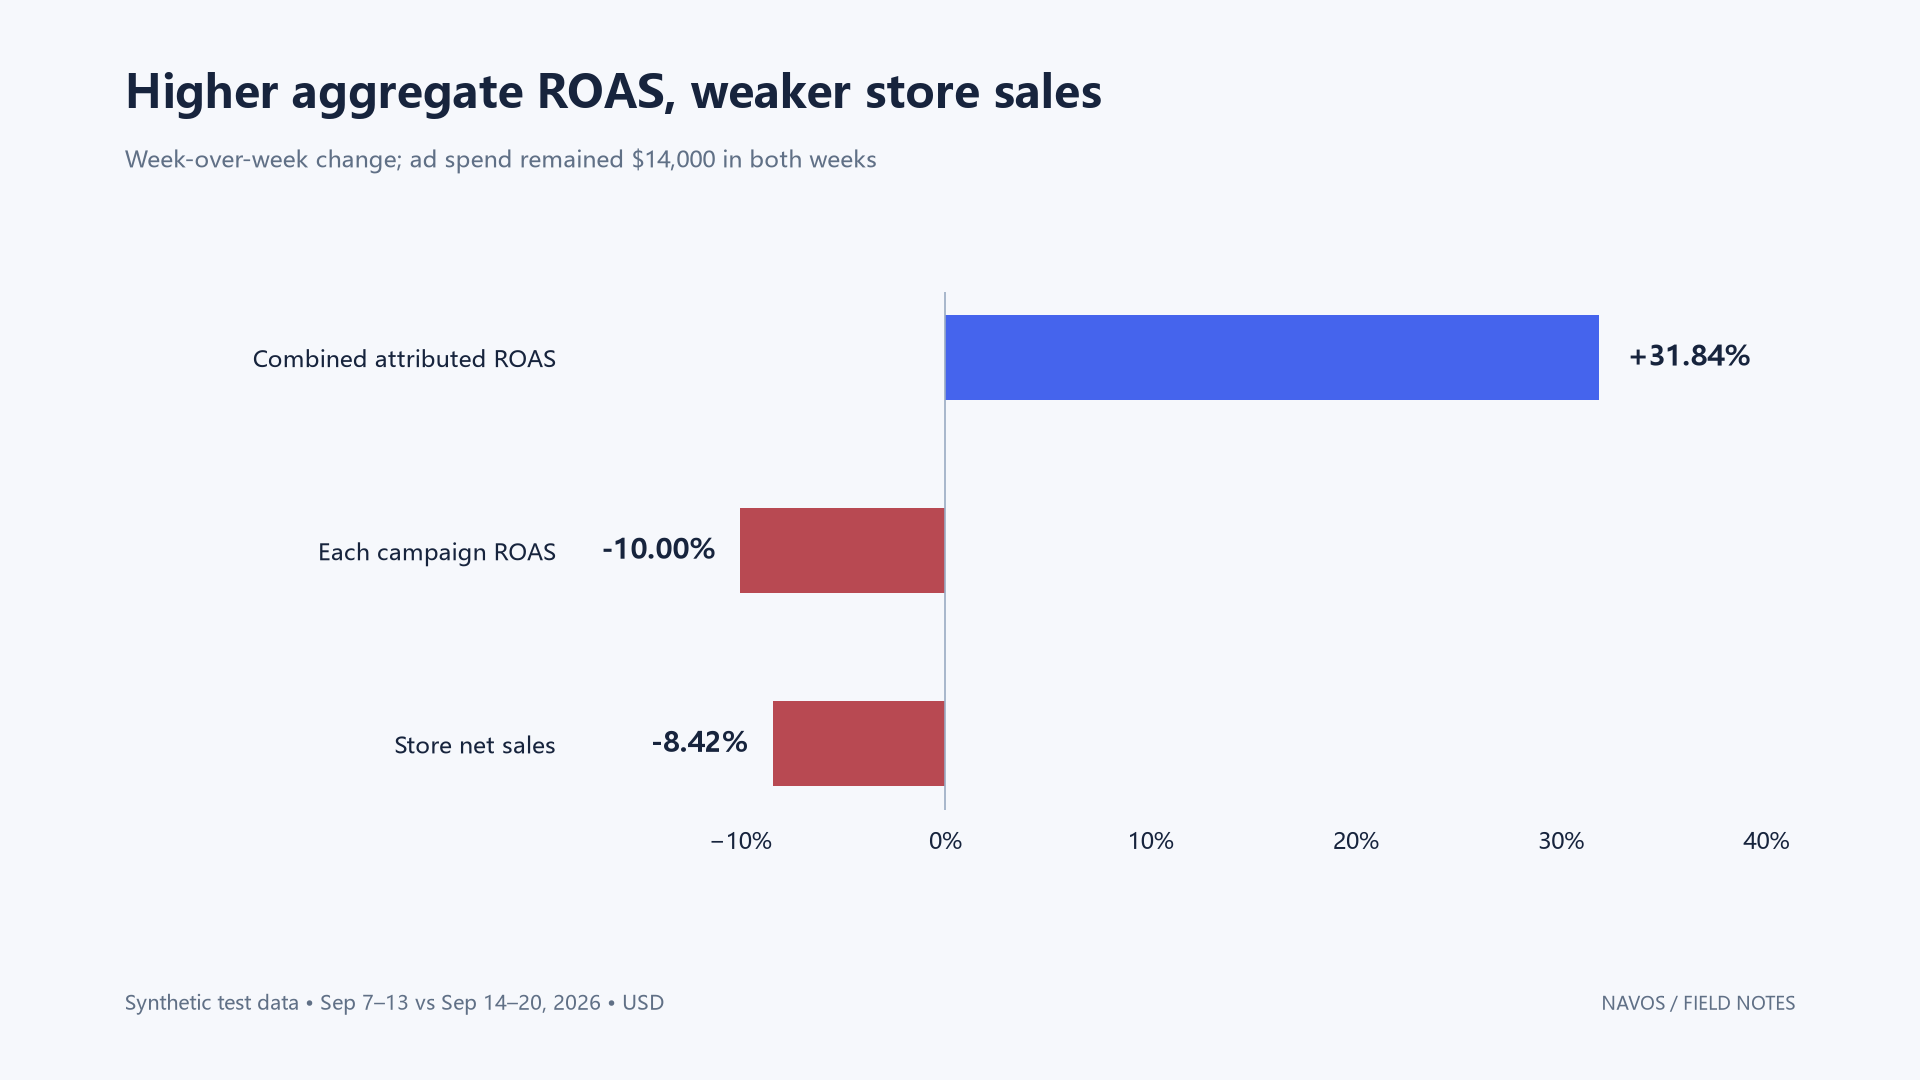
Here, combined platform-attributed ROAS means the sum of platform-credited revenue divided by total ad spend. It is a descriptive aggregate of the supplied exports. It is not deduplicated store revenue or an incremental return.
Store net sales follow a different definition: gross product sales minus refunds booked during the period. Those refunds may relate to earlier purchases. The increase in booked refunds therefore does not establish that this week's buyers returned more of this week's orders.
The weekly summary should retain both views:
Advertising platforms credited more revenue on unchanged spend, while the store recorded lower net sales. Reconcile the reporting differences before treating the ROAS increase as evidence that the business improved.
Do not add platform-attributed revenue to store sales. They describe different views of sales activity. Nor can the $22,155 gap between second-week attributed revenue and store net sales be labeled duplicate attribution: order IDs, attribution settings, and timing reconciliation were not supplied.
Explain why total ROAS rose while every campaign declined
The campaign table makes the apparent contradiction understandable.
Campaign | Week 1 spend | Week 2 spend | Week 1 ROAS | Week 2 ROAS |
Google brand search, GS-B | $1,400 | $4,200 | 6.00 | 5.40 |
Google non-brand search, GS-N | $4,200 | $2,100 | 2.50 | 2.25 |
TikTok prospecting, TT-P | $7,000 | $3,500 | 2.00 | 1.80 |
TikTok retargeting, TT-R | $1,400 | $4,200 | 5.00 | 4.50 |
Every campaign's ROAS fell by 10%. However, brand search and retargeting—the two campaigns with higher attributed ROAS in this sample—grew from 20% to 60% of total spend.
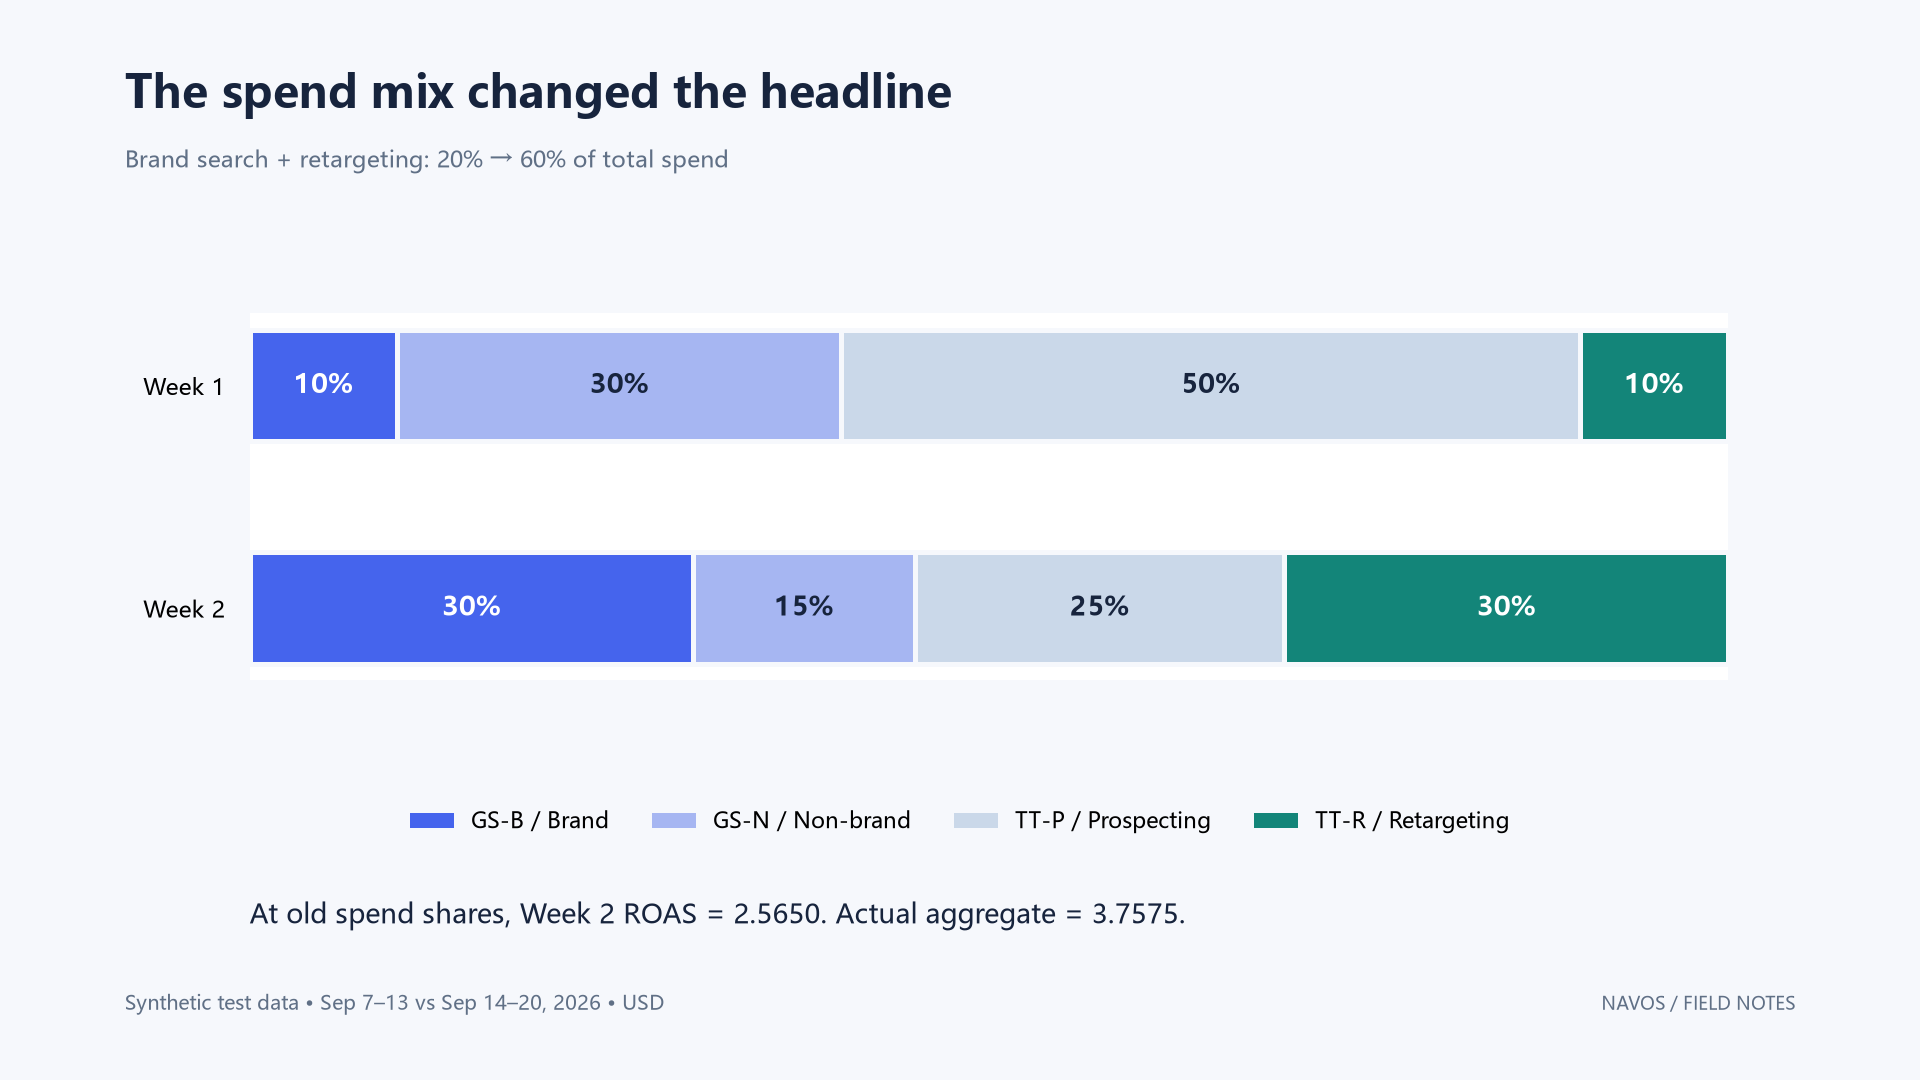
Combined ROAS is a spend-weighted average. Its weights changed substantially.
To see the effect, apply the second week's campaign ROAS values to the first week's spend shares:
10% × 5.40 + 30% × 2.25 + 50% × 1.80 + 10% × 4.50 = 2.5650.
At the old allocation, the second week's combined ROAS would be 2.5650 rather than 3.7575. Under this decomposition, changes within campaigns contribute −0.2850 ROAS points, and the allocation shift contributes +1.1925 points. Together they explain the observed increase of 0.9075 points from 2.85 to 3.7575.
This is an arithmetic explanation, not a causal estimate of what reallocating budget would produce. The files do not establish incremental sales, audience capacity, or the return on the next dollar spent.
That distinction changes the meeting. Instead of celebrating a broad improvement in advertising efficiency, the team can investigate why each campaign weakened and how the new spend mix relates to store sales and customer acquisition.
Keep incomplete metrics visible without inventing totals
The campaign file contained 66 rows, including two exact repeated exports. Removing those repeats left 64 unique campaign-day records. The supplied dictionary defined exact repeats as duplicate exports, so counting them again would inflate activity.
There was also a missing purchase count for TikTok retargeting on September 16. It was an unavailable value, not zero.
The second week therefore has two useful but different statements:
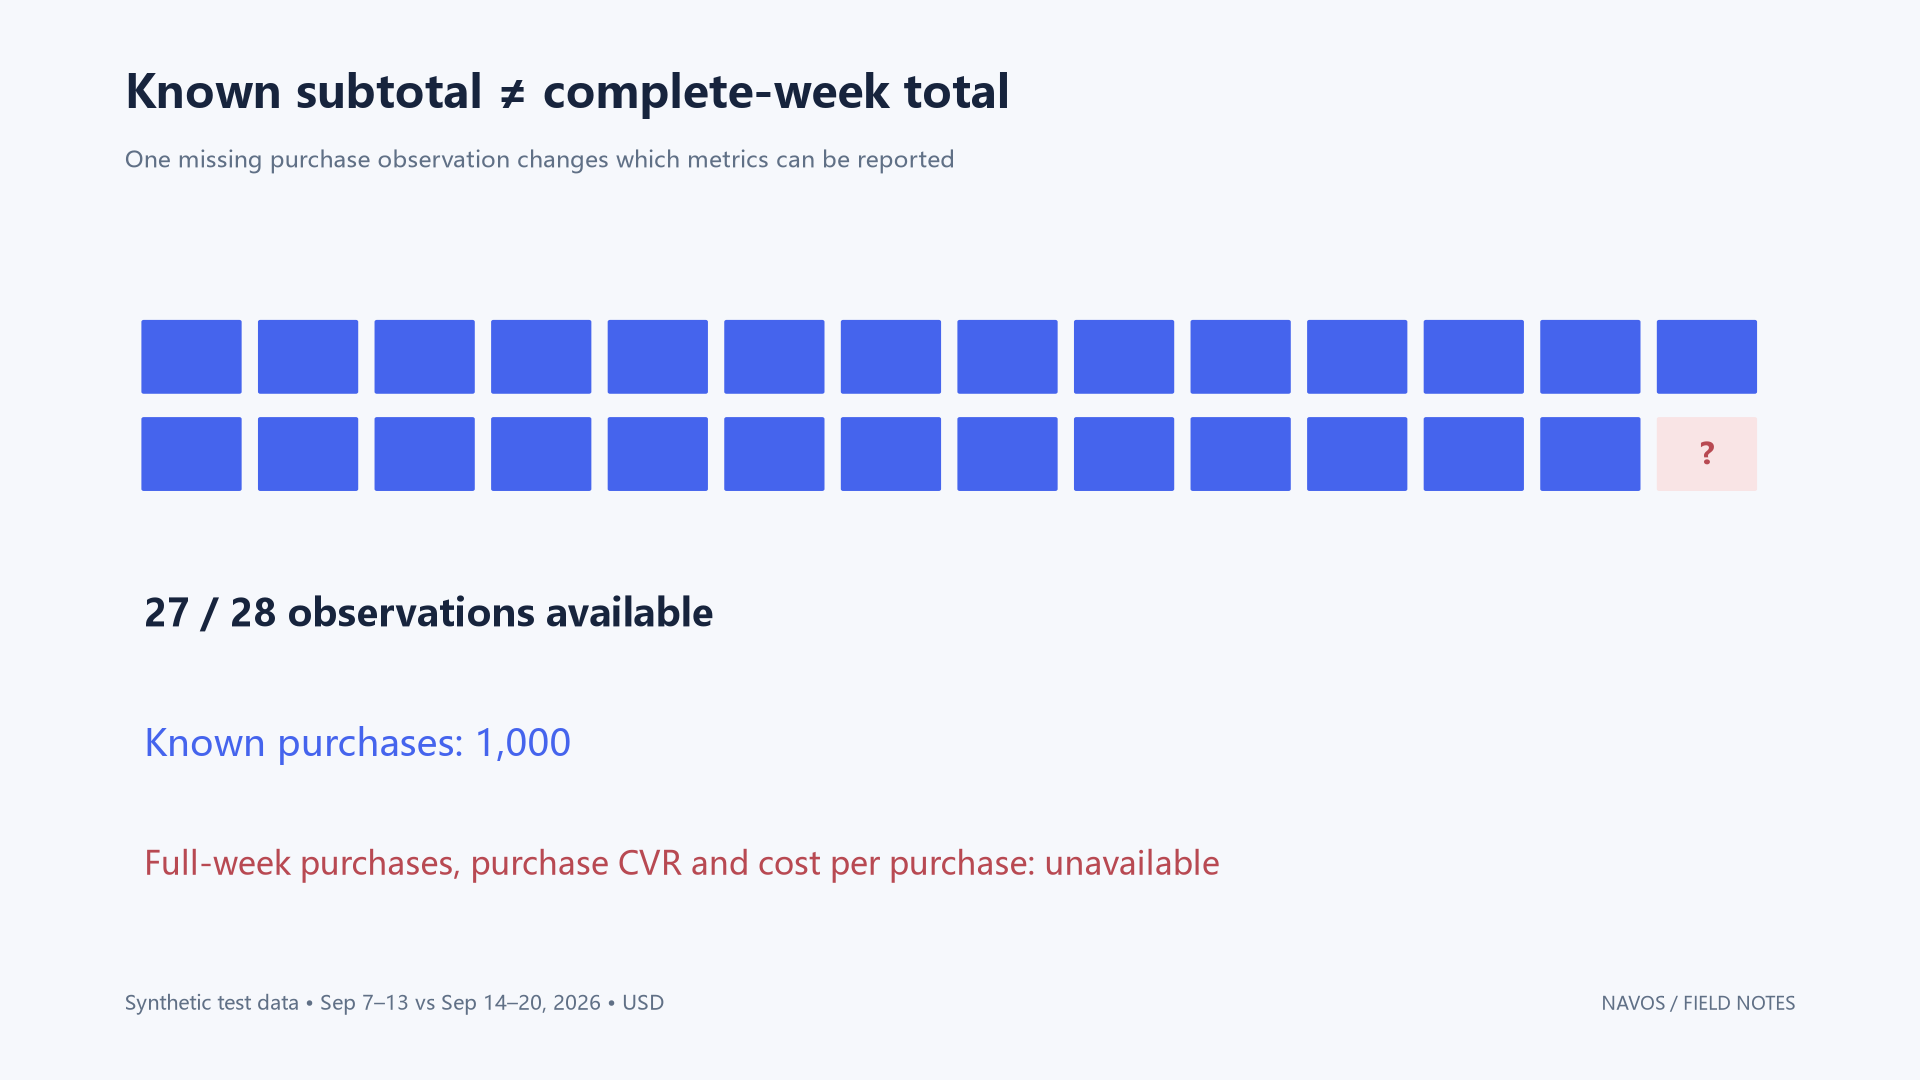
- Known purchase subtotal: 1,000 across 27 of 28 expected campaign-day observations.
- Complete-week purchase total: unavailable until the missing observation is resolved.
For TT-R alone, the known subtotal is 324 across six of seven days. Neither subtotal should be compared with a complete previous week as if both periods had full coverage.
The same rule applies to derived metrics. Complete-week purchase conversion rate and cost per purchase remain unavailable. Dividing all $14,000 of spend by the known 1,000 purchases would mix a complete numerator with an incomplete denominator.
If a subset calculation is useful, match the records on both sides. The rows with available purchases contain $13,400 of spend and 1,000 purchases, giving $13.40 per purchase for that subset only. Label its coverage; do not present it as the weekly result or as customer acquisition cost, since new-customer counts were not supplied.
Finally, show September 21–22 separately. Two days of activity cannot support a complete-week comparison simply because they appear in the same file.
Turn the report into three follow-up decisions
The useful ecommerce work starts when each finding has a named follow-up. The following table condenses the accepted report's action plan for a review meeting; no account changes were executed in this test.
Finding | Follow-up and proposed owner | Evidence needed before deciding |
Platform revenue rose while store net sales fell | Marketing analyst and store operations: reconcile the two reporting views | Order-level records, attribution windows/settings, date assignment, and refund timing |
Brand search and retargeting gained spend share | Growth lead: examine how new and returning customers contributed | Customer classification rules, comparable customer counts, and order values; campaign names alone do not establish customer status |
Higher aggregate ROAS does not establish profitability | Finance and paid media lead: assess contribution and the case for expansion | Product, fulfillment, platform, and payment costs on a consistent basis, plus evidence about marginal returns and available capacity |
For this sample, the evidence does not yet justify a budget increase. Holding a decision pending reconciliation is a provisional control, not proof that the existing allocation is optimal.
Costs matter because net sales are not profit. Even a positive contribution before advertising can be smaller than the advertising bill. Without the missing costs, the report should leave contribution after advertising unresolved rather than fill in a margin assumption.
This connection between campaign numbers, store records, and the work of several operating roles is the most useful part of the Navos result for an ecommerce team. It gives people a concrete agenda for the next review. Navos's retail analytics overview provides broader context for this type of workflow; the evidence here remains the specific file-based test.
How to run an ecommerce weekly review in Navos
Start with the Navos desktop download page. In the tested PC interface, open Square → Operational Reports, find
business-review-campaign-performance-review, and select Use. This is the Skill confirmed for this test; interface labels may change.Prepare campaign and store exports plus a short dictionary defining each field. State the row grain, currency, timezone, week boundary, missing-value meaning, and whether refunds belong to the booking period or the original order cohort. Remove unnecessary personal data before using your own files.
Then give Navos a concrete review task. This is an editorial prompt template based on the lessons of the test, not the original blind-test prompt:
Review the attached campaign and store data for our weekly ecommerce meeting.

Compare the two most recent complete Monday–Sunday weeks. Show later dates
separately. Use the supplied dictionary for currency, timezone and definitions.

Check record keys, exact duplicates, conflicting rows and missing values before
aggregating. Do not resolve conflicting observations silently. Distinguish known
subtotals from complete totals, and show coverage for affected metrics.

Report campaign results, spend shares, platform-attributed revenue and store net
sales separately. Explain any disagreement between aggregate and campaign trends.
Do not infer profit, incrementality or new-customer acquisition without evidence.

Deliver a weekly scorecard, a campaign breakdown, data quality notes, and three
next actions with proposed owners and the data needed to revisit each decision.
Include an HTML report, KPI CSV, calculation script and validation notes.
Review the output against the inputs before circulating it. In our accepted run, the HTML, CSV, script, and validation log formed a traceable deliverable set. The independent check also confirmed that the submitted script stopped when an intentionally conflicting record was added in an isolated test.
That validates the fixed case, not every future export. The script contained case-specific dates and checks, so it should not be described as a verified recurring automation. Report rendering should also be checked before sharing screenshots; this review verified content and reproduction, not the charts' appearance in a browser.
Frequently asked questions
What should an ecommerce weekly marketing report include?
Include a short summary, complete-period KPIs, campaign results with spend shares, data quality notes, a business interpretation, and actions with owners. Keep platform-attributed revenue and store sales clearly labeled so readers can see which question each number answers.
Can AI create the report from CSV files?
In this Navos test, file inputs led to an HTML report, KPI CSV, Python script, and validation log. The accepted result followed three feedback rounds. Use this as evidence for an assisted review workflow, not a guarantee that every first response will be correct.
Why can ROAS improve when individual campaigns get worse?
The share of spend assigned to each campaign can change. In this sample, more spend went to campaigns with higher attributed ROAS, raising the combined ratio despite a decline within every campaign. Check the weights before interpreting the headline.
Should a missing purchase count be treated as zero?
Only if the source explicitly defines it as zero. Here, a blank meant unavailable. The report retained known subtotals and marked complete-week purchase metrics unavailable instead of inventing a value.
Can the report decide next week's budget automatically?
This test did not validate automatic budget decisions or account changes. It identified what needed reconciliation and which costs and customer data were missing. Those checks make the next budget discussion more useful, without pretending the supplied files answer every question.
Ready to prepare your next review? Open the Navos desktop download page, choose the campaign performance review Skill, and bring your campaign exports, store sales, and metric definitions. Ask for a report that makes both its findings and its unanswered questions easy to check.