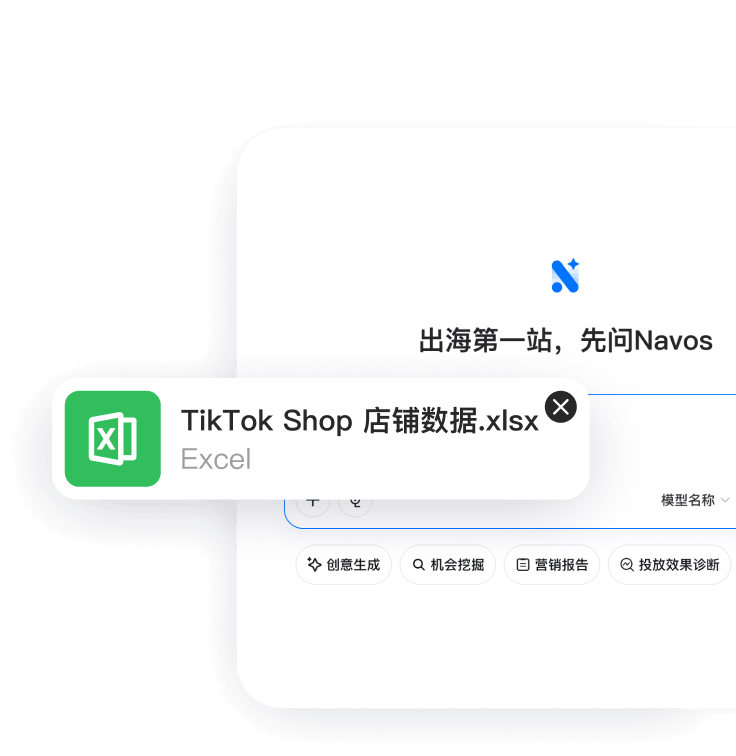
Upload your Excel or CSV file
Sign in to the Navos web app and drop your dataset into the workspace — survey responses, experiment results, sales records, or any tabular data you need to analyze.
Navos is a statistics AI that runs statistical analysis on an uploaded Excel or CSV file and explains every result in plain language. The AI Data Analyst computes descriptive statistics, distributions, correlations, outliers, and group comparisons in code — no SPSS, R, or Python required — and writes up what the numbers actually mean.
Works with .xlsx and .csv · English & Chinese write-ups · Results in minutes
Three steps from raw data to statistics you can defend.
Sign in to the Navos web app and drop your dataset into the workspace — survey responses, experiment results, sales records, or any tabular data you need to analyze.
The Data Report Generator skill profiles the dataset programmatically — descriptive statistics, distributions, missing values, outliers, correlations — every figure computed deterministically, not estimated.
You get an interactive report: the statistics, the charts, and a written interpretation of what each result means and which findings deserve attention. Ask follow-up statistical questions in chat.
Statistical software gives you output. Navos gives you output you can understand and defend.
Ang bawat statistic ay kinukwenta sa code habang data profiling. Ang language model ay nag-iinterpret ng mga resulta — hindi nito iniimbento ang mga numero.
Ang mga missing values, inconsistent formats, at outliers ay natutuklasan at naiuulat bago ang anumang analysis, upang malaman mo kung gaano ka mapagkakatiwalaan ang bawat resulta.
Descriptive statistics, distribution shapes, correlation analysis, outlier detection, at segment comparisons — pinili upang umangkop sa iyong datos, hindi isang fixed menu.
Walang misteryosong output tables. Ang bawat statistic ay may kasamang plain-language interpretation: kung ano ang ibig sabihin nito, bakit mahalaga, at kung ano ang susuriin susunod.
Buuin ang parehong statistical analysis sa Ingles o Filipino — handa para sa coursework, research collaboration, o business reporting.
Ang analysis ay dumarating bilang shareable artifact na may executive summary — isumite ito, ipadala ito, o patuloy na mag-drill down sa chat.
If it fits in a spreadsheet, the statistics AI can analyze it and explain it.
I-upload ang survey responses at makakuha ng buong questionnaire data analysis: response distributions, segment differences, at kapansin-pansing pattern — nang walang pag-code ng kahit isang crosstab.
Descriptive statistics, correlations, at distribution analysis para sa theses, papers, at class projects — na may mga interpretasyong maaari mong banggitin at ipagtanggol.
Paghambingin ang mga grupo, tuklasin ang outliers, at subukan kung ang pagkakaiba sa pagitan ng segments o periods ay talagang namumukod-tangi mula sa ingay.
Statistical profiling ng mga transaksyon at operations data: trends, seasonality signals, correlation sa pagitan ng drivers, at anomaly detection.
Ang statistics AI ay software na nagpapatakbo ng statistical analysis sa iyong datos at nagpapaliwanag ng mga resulta sa natural na wika. Ipinapatupad ito ng Navos sa pamamagitan ng two-stage pipeline: ang statistics ay deterministikong kinukwenta sa code habang data profiling, pagkatapos ang AI Data Analyst ay nag-interpret ng output at sumusulat ng mga natuklasan.
Oo — kung ang mga numero ay kinukwenta sa code. Hindi kailanman hinihiling ng Navos sa isang language model na tantiyahin ang isang statistic: descriptive statistics, distributions, correlations, at outlier detection ay pawang programmatic na tumatakbo, at ang papel ng AI ay interpretasyon at paliwanag.
Para sa descriptive statistics, distribution analysis, correlations, outlier detection, at group comparisons sa spreadsheet data — oo, at makakakuha ka ng plain-language interpretation sa halip na output tables. Para sa specialized inferential procedures at academic modeling workflows, ang mga dedicated packages tulad ng SPSS o R ay nananatiling tamang tool.
I-export ang iyong mga tugon bilang Excel o CSV (mula sa Google Forms, Qualtrics, SurveyMonkey, o anumang survey tool), i-upload ang file sa Navos, at humingi ng analysis. Makakakuha ka ng response distributions, segment comparisons, at written findings sa ilang minuto.
Ang data profiling ay sumasaklaw sa descriptive statistics (means, medians, spreads), distribution shapes, missing-value at outlier detection, correlation analysis, at segment o period comparisons. Maaari kang humiling ng specific cuts at follow-up analyses sa chat.
Hindi. Ang bawat resulta ay ipinaliliwanag sa payak na wika — kung ano ang ibig sabihin ng numero at kung bakit ito mahalaga. Kung marunong ka ng statistics, ang mga underlying figures ay naroon lahat upang i-verify.
Ang ToolPak ay nagpapatakbo ng indibidwal na procedures na manu-mano mong kino-configure at nagbabalik ng raw output tables. Ang Navos ay nagpi-profile ng buong dataset nang awtomatiko, pumipili ng mga kaugnay na analysis, kinukwenta ang mga ito sa code, at sumusulat ng interpretasyon — ang pagkakaiba sa pagitan ng calculator at analyst.
Excel (.xlsx) at CSV. I-export mula sa anumang tool na gumagawa ng tabular data — survey platforms, experiment trackers, POS systems, CRMs, o plain spreadsheets.
Oo. Ang Navos ay sumusunod sa privacy-first architecture at sumusunod sa pandaigdigang privacy standards tulad ng GDPR at CCPA. Ang iyong mga na-upload na file ay ginagamit upang makabuo ng iyong sariling analysis at hindi ibinabahagi sa ibang mga customer.
Upload your dataset and let the statistics AI compute, chart, and explain the analysis.